Fat Metabolism Simplified
Author: Dr. Stephen Chaney
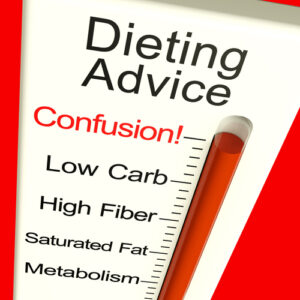 If you are like most Americans, you have vowed to lose weight and/or gain health in 2023. But how do you do that? There are hundreds of diets to choose from. And each diet has its “story” – a mixture of pseudo-science and testimonials – designed to convince you to try it.
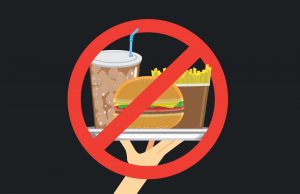
Forget the pseudo-science. Forget the testimonials. Instead, focus on the one thing these diets have in common. They are all whole food diets. They all eliminate sodas, fast foods, and highly processed convenience foods.
In fact, that may be the simplest thing you can do to lose weight and become healthier. Many experts say that any time you eliminate sodas, fast foods, and convenience foods you will lose weight. If that statement is true, it could explain the American obesity epidemic. Between 1977 and 2017, a span of just 40 years, fast food consumption:
- Increased from 6% to 35% (a 6-fold increase) in the 40-65 age group, and…
- 11% to 46% (a 4-fold increase) in the 12-39 age group.
But is it true? There are certainly reasons to think it might be:
- Fast foods are high in fat, sugar, and calories and are low in fiber – all of which are associated with obesity.
- Big Food Inc has researched the ideal combination of taste, mouth feel, and effect on blood sugar to create an addiction to fast food.
However, the studies linking fast food consumption to obesity have been flawed.
- People who consume fast foods tend to exercise less and have a poorer diet, even when they are eating at home. Previous studies have not distinguished between fast food consumption and other things (diet, exercise, lifestyle) that are also linked to obesity.
- Previous studies have often only assessed diet and other lifestyle factors at the beginning or end of the study. There is no way of knowing whether these values are typical for the entire timespan of the study.
- Previous studies have only shown associations, not cause and effect.
The current study (AO Odegaard et al, American Journal of Clinical Nutrition, 116: 255-262, 2022) was designed to eliminate many of the flaws in previous studies.
Fat Metabolism Simplified
 You have probably heard that belly fat increases your risk of diabetes, heart disease, stroke, Alzheimer’s, and some cancers. This study looked at the effect of fast foods on belly fat, muscle fat, and fatty liver (liver fat).
However, belly fat is both simple and complicated:
- It is simple in that it is easy to see. We talk about it as an “apple shape” and we measure it in waste circumference.
- It is complicated because, anatomically, there are several subtypes of belly fat, and these authors chose to examine the effect of fast foods on each subtype.
- However, the effect of fast foods on each subtype of belly fat, and the metabolic effects of each subtype, are similar. So, in the interest of simplicity, I will combine the subtypes and simply refer to the effect of fast foods on belly fat.
With that in mind, here is all you need to know about biology and metabolism of fat.
In addition to fat accumulation in the abdomen (belly fat), this study also looked fat accumulation in muscle (which I will refer to as muscle fat) and liver (which I will refer to as liver fat).
All three types of fat contribute to metabolic syndrome (prediabetes) characterized by:
- Insulin resistance, which leads to an elevation of both glucose and insulin.
- High LDL (bad cholesterol) and low HDL (good cholesterol).
- High triglycerides.
- High blood pressure.
- Inflammation
These metabolic effects increase the risk of diabetes, heart disease, stroke, Alzheimer’s, inflammatory diseases, and some cancers.
In addition, liver fat can lead to non-alcoholic liver disease, fibrosis of the liver, and cirrhosis of the liver.
How Was This Study Done?
 This study recruited 5115 participants from the Coronary Risk Development in Young Adults (CARDIA) study. This study recruited young adults (average age of 25) in 1985-1986 and followed them for 25 years. The participants were 57% female and 53% white.
As stated above, this study looked at the effect of fast foods on belly fat, muscle fat, and fatty liver (liver fat).
This study had numerous strengths:
- Unlike many other studies, variables like diet, fast food intake, and lifestyle were measured at multiple times during the study.
-
- All participants entered treatment centers for physical exams, bloodwork, and lifestyle questionnaires at entry into the study (year 0) and again at years 2, 5, 7, 10, 15, 20, and 25.
-
- On years 0, 7, 10, 15, 20, and 25 the questionnaires included the question, “How many times in a week or month do you eat breakfast, lunch, or dinner out in a place such as McDonald’s, Burger King, Wendy’s, Arby’s, Pizza Hut, or Kentucky Fried Chicken?” This question was used to calculate the number of times per week that participants ate fast food meals.
-
- On years 0, 7, and 10 the quality of the non-fast-food portion of their diet was assessed by asking the participants to complete a comprehensive questionnaire about their typical intake of foods over the past month.
-
-
- Diet quality was calculated using something called an alternative Mediterranean diet score because this calculation excludes foods commonly consumed at fast food restaurants. Thus, this calculation specifically measures the quality of the non-fast-food portion of their diet.
-
-
- Each of these variables was averaged over the entire timespan of the study and trends (either an increase or decrease over time) were noted.
-
- The outcomes of the study (belly fat, muscle fat, and liver fat) were measured at the end of the study (year 25) using CT imaging techniques.
2) The authors identified other factors that may have caused fat accumulation and corrected for them. For example:
-
- Participants with the highest fast food consumption had lower educational level, lower income, poorer non-fast-food diet quality, lower physical activity, lower alcohol intake, higher caloric intake, and were more likely to be male and black.
-
- Consequently, the data comparing fast food intake with fat accumulation were corrected for age, sex, race, education, income, smoking, alcohol, diet quality, caloric intake, and physical activity.
Is Fast Food Fat Food?
 Fast food intake was equally divided into quintiles ranging from “Never to once a month” to “≥ 3 times per week”. When participants with the highest fast food intake over the past 25 years were compared to those with the lowest:
- Their belly fat was higher by 48%.
- Their muscle fat was higher by 27%
- Their liver fat was 5-fold higher.
- Their waist circumference (another measure of belly fat) was 11% (4 inches) more.
- Their BMI (a measure of obesity) was 15% higher.
The authors concluded, “The results of this analysis robustly demonstrate that middle-aged adults who ate fast food more frequently over the past 25 years have significantly higher odds of MAFLD [fatty liver disease] and IAAT [belly fat]…aligned with poorer current and future cardiometabolic health [heart disease and diabetes] and chronic disease risk.”
What Does This Study Mean For You?
 Several previous studies have shown that fast food consumption leads to fat accumulation and/or obesity. However, this is perhaps the best designed study on the effect of fast foods on fat accumulation and obesity to date. This is because:
- It measured fast food consumption, non-fast-food diet quality, exercise, and many other lifestyle factors at multiple times during the 25-year study. That way we can be assured we are looking at fast food consumption and other lifestyle choices over the entire 25-year timespan of the study, not just at the beginning or end of the study.
- The authors corrected the data for other lifestyle factors known to influence fat accumulation and obesity. Statistical corrections are never perfect, but these authors did their best to make sure the study only measured the effects of fast food consumption on fat accumulation.
Of course, this kind of study shows associations. It does not prove cause and effect. However, since 25-year double blind, placebo-controlled studies are not possible, this is perhaps the best study we may ever have.
That brings me back to your New Year resolutions. If you are like most Americans, you have probably resolved to lose weight and get healthier in past years – only to end the year fatter and less healthy than you started it.
You have probably tried dozens of diets. They worked for a while, but they were difficult to follow long term, and eventually you abandoned them.
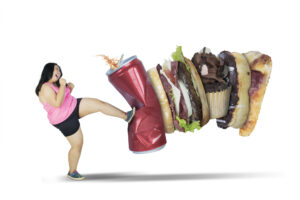
My suggestion this year is to forget the crazy diets. Just go for a simple change. Eliminate sodas, fast foods, and convenience foods from your diet. You will lose weight. And you will be healthier. Guaranteed.
Of course, it’s not that simple. Remember that Big Food Inc has designed these foods to be addictive. Unless you have an iron will, you probably won’t be able to go cold turkey.
You may need a gradual approach. Replace sodas, fast and convenience foods one at a time. Find healthier substitutes for each fast food you replace. Then explore more convenient ways to eat healthy. It will be a journey. But the end results will be worth it.
The Bottom Line
If you are like most Americans, you have vowed to lose weight and/or gain health in 2023. But how do you do that? There are hundreds of diets to choose from. And each diet has its “story” – a mixture of pseudo-science and testimonials – designed to convince you to try it.
Forget the pseudo-science. Forget the testimonials. Instead, focus on the one thing these diets have in common. They are all whole food diets. They all eliminate sodas, fast foods, and highly processed convenience foods.
Many studies have implicated sodas, fast and convenience foods in obesity and fat accumulation in our bodies. But these studies have all had their flaws.
A recent study looked at the association between fast food intake and 3 kinds of fat (belly fat, muscle fat, liver fat) over 25 years. All 3 kinds of fat are highly associated with metabolic syndrome (prediabetes) and several chronic diseases. More importantly, this study was designed to eliminate many of the flaws in previous studies.
When participants with the highest fast food intake over the past 25 years were compared to those with the lowest:
- Their belly fat was higher by 48%.
- Their muscle fat was higher by 27%.
- Their liver fat was 5-fold higher.
- Their waist circumference (another measure of belly fat) was 11% (4 inches) more.
- Their BMI (a measure of obesity) was 15% higher.
The authors concluded, “The results of this analysis robustly demonstrate that middle-aged adults who ate fast food more frequently over the past 25 years have significantly higher odds of MAFLD [fatty liver disease] and IAAT [belly fat]…aligned with poorer current and future cardiometabolic health [heart disease and diabetes] and chronic disease risk.”
Simply put, the best thing you can do for your weight and your health this year is to eliminate sodas, fast foods, and convenience foods from your diet. You will lose weight. And you will be healthier. Guaranteed.
For more details on this study, read the article above.
These statements have not been evaluated by the Food and Drug Administration. This information is not intended to diagnose, treat, cure, or prevent any disease.