Are Our Teens Getting Sicker?

What Does This Mean For Us?

Author: Dr. Stephen Chaney

High Blood SugarThe increase of prediabetes and type 2 diabetes in the US adult population has been well documented. And these conditions have severe health consequences.

  • Nearly 70% of people with prediabetes will go on to develop type 2 diabetes.
    • Without a change in lifestyle and/or medical intervention, many people with prediabetes develop type 2 diabetes within 5 years.
  • Type 2 diabetes is highly correlated with increased risk for heart disease and stroke, vision loss, kidney disease, nerve damage, and cognitive decline.
  • And as we learned during COVID, diabetes suppresses the immune system, making us much more likely to die from viral infections ranging from flu to RSV and coronaviruses like SARS-CoV-2.

Because both prediabetes and type-2 diabetes are highly correlated with obesity, the US Preventative Services Task Force has recently recommended regular screening of adults aged 35-70 who are overweight or obese for prediabetes and type-2 diabetes.

But what about our teenagers? Are they at risk? Should they be screened also? Recent reports have documented an alarming increase in overweight and obesity in this population group.

The prevalence of type-2 diabetes is low in this group, but previous studies have reported that approximately 1 in 5 US teenagers have prediabetes. Is this a ticking time bomb that will affect their health as adults? More importantly, is the prevalence of prediabetes getting worse, just as it is for the adult population?

The expectation is that the prevalence of prediabetes in US teens is increasing, just as it is for US adults. But scientists and health organizations like the Preventive Services task force require hard data, not just expectations.

So, the study (J Liu et al, JAMA Prediabetes, 176: 608-610, 2022) I will describe today was designed to determine the prevalence trend over the past 20 years for prediabetes in US teenagers.

How Was The Study Done?

clinical studyThe study used data from the NHANES database from 1999 to 2018. NHANES (National Health and Nutritional Examination Survey) is a program administered by the CDC that collects health and nutrition information from adults and children in the United States on a biennial basis.

Among the data collected are demographic information (sex, age, race, economic status, etc.), physical exam information (BMI, blood chemistry, etc.), and health information (prediabetes, diabetes, etc.).

To have enough participants in each time period for statistically significant results, the data were combined for each two consecutive 2-year surveys. (For example, the 2000-2001 and 2001-2002 NHANES surveys were combined into a single dataset from 1999 to 2002.)

The time periods included in this study were 1999-2002, 2003-2006, 2007-2010, 2011-2014, and 2015-2018. A total of 6598 teenagers were included in this study, for an average of around 1,300 per time-period.

The main comparison was prediabetes prevalence among US teens in each time period. The study also looked at the effect of obesity and various sociodemographic classifications on prediabetes prevalence in teens.

Are Our Teens Getting Sicker?

diabetesWhen the 2015-2018 time period was compared to the 1999-2002 time period, the prevalence of prediabetes:

  • Increased from 11.6% to 28.2% – a 2.43-fold increase.

When broken down by age groups, the increase was:

  • 2.35-fold for ages 12-15.
  • 2.56-fold for ages 16-19.

When broken down by gender, the increase was:

  • 2.76-fold for females.
  • 2.30-fold for males.

When broken down by race and ethnicity, the increase was:

  • 2.10-fold for Hispanics.
  • 2.76-fold for Blacks.
  • 2.33-fold for Whites.

None of these differences were statistically significant, but they might have been had the sample size been larger.

In short, there has been more than a 2-fold increase in the prevalence of prediabetes in US teenagers over the last 20 years. And this increase was seen in young teenagers, older teenagers, male and female teenagers, and in every racial and ethnic category surveyed.

Why Is Prediabetes Increasing In Our Teens?

QuestionsKnowing the trend is important. But if you want to reverse the trend, it’s much more important to know what is causing it.

Of course, obesity is an obvious villain. Obesity is highly associated with prediabetes and type 2 diabetes, and we know that obesity is increasing in our teens. The data from this study suggests that obesity may contribute to the increase in prediabetes prevalence. But it’s not likely to be the sole cause.

For example:

  • Obesity in our teens has only increased 1.3-fold over the last 20 years.
  • More importantly, the difference in prediabetes prevalence between normal weight and overweight teens was not significant in this study.

The authors of this study also found no significant effect of educational level of the parents, family income level, or food security on the increased prevalence of prediabetes prevalence in teens.

So, what else might be contributing to the increased prevalence of prediabetes in our teens? I have two suggestions:

  • Decreased physical activity. Teens today are spending more hours staring at screens and less time exercising. Lack of exercise contributes to obesity, but there is also emerging evidence that it may independently contribute to diseases like prediabetes and diabetes.
  • Increased junk food consumption. Teenager’s diets have never been great, but multiple studies have shown that consumption of highly processed food has skyrocketed over the past 20 years.

Obviously, more work needs to be done on proving the causes of increased prediabetes prevalence in our teens, but we know enough already to start making some needed changes.

What Does This Study Mean For Us?

If you are a parent or grandparent, this study is a wake-up call. It’s not that we didn’t already suspect it was happening. After all, the increasing prevalence of type 2 diabetes in young US adults had to come from somewhere.

But this study makes it clear that prediabetes is increasing at an alarming rate in our teenage children (and grandchildren). This is a ticking time bomb.

As I said above, prediabetes leads to diabetes. And diabetes leads to heart disease and other debilitating diseases. Unless we reverse this trend, we may be dooming our teens to poor health and a shortened lifespan as adults.

So, the important questions become, “What can we do about it?” and “What can we do to reverse this trend?”

The top three things we can do are clear. We need to encourage our teens to:

  • Exercise more. Only 1 in 4 high school students get the recommended amount of daily activity.
  • Eat a healthier diet. Today more than 2/3 of the calories our teens consume come from ultraprocessed foods.

And we know the changes they need to make. Previous studies have shown that whole food, primarily plant-based diets reduce the risk of developing prediabetes and type 2 diabetes and can even reverse both conditions as effectively as medications.

  • Maintain a healthier weight. The prevalence of obesity in our teens has increased dramatically in the last 40 years. Of course, the secret is that if they get the diet and exercise part right, weight control is much easier.

But none of these changes are easy. This can’t be a, “Do as I say, not as I do” change. This needs to be a whole family change. We need to set the example.

Of course, I know some teens like to rebel against anything their parents do or recommend. We had a teenager once.

Setting the example doesn’t necessarily mean they will accept it right away. But with time they may come around. They are listening to what you say and watching what you do even when they are doing the opposite.

And I can guarantee if you aren’t willing to make these changes, they won’t be either.

The Bottom Line

A recent study looked at the prevalence of prediabetes in US teenagers over the past 20 years. The results were alarming.

  • The prevalence of prediabetes in US teens has more than doubled over the past 20 years.
  • In 2018, the last year in this study, the prevalence of prediabetes was in the 25-30% range.
  • The increased prevalence of diabetes was independent of gender, income, food security, ethnicity, and education level of the parents.

If you are a parent or grandparent, this is a ticking time bomb because 70% of people with prediabetes go on to develop type 2 diabetes within the next 5 years. And type 2 diabetes dramatically increases the risk of heart disease, stroke, kidney disease, vision loss, and cognitive decline. We may be dooming our teens to poor health and a shortened life span as adults.

For more details about this study, the causes of the increased prevalence of prediabetes in teens, and what you can do to reverse this trend for your teens, read the article above.

These statements have not been evaluated by the Food and Drug Administration. This information is not intended to diagnose, treat, cure, or prevent any disease.

 _____________________________________________________________________________

My posts and “Health Tips From the Professor” articles carefully avoid claims about any brand of supplement or manufacturer of supplements. However, I am often asked by representatives of supplement companies if they can share them with their customers.

My answer is, “Yes, as long as you share only the article without any additions or alterations. In particular, you should avoid adding any mention of your company or your company’s products. If you were to do that, you could be making what the FTC and FDA consider a “misleading health claim” that could result in legal action against you and the company you represent.

For more detail about FTC regulations for health claims, see this link.

https://www.ftc.gov/business-guidance/resources/health-products-compliance-guidance

 _____________________________________________________________________

About The Author 

Dr. Chaney has a BS in Chemistry from Duke University and a PhD in Biochemistry from UCLA. He is Professor Emeritus from the University of North Carolina where he taught biochemistry and nutrition to medical and dental students for 40 years.  Dr. Chaney won numerous teaching awards at UNC, including the Academy of Educators “Excellence in Teaching Lifetime Achievement Award”. Dr Chaney also ran an active cancer research program at UNC and published over 100 scientific articles and reviews in peer-reviewed scientific journals. In addition, he authored two chapters on nutrition in one of the leading biochemistry text books for medical students.

Since retiring from the University of North Carolina, he has been writing a weekly health blog called “Health Tips From the Professor”. He has also written two best-selling books, “Slaying the Food Myths” and “Slaying the Supplement Myths”. And most recently he has created an online lifestyle change course, “Create Your Personal Health Zone”. For more information visit https://chaneyhealth.com.

For the past 45 years Dr. Chaney and his wife Suzanne have been helping people improve their health holistically through a combination of good diet, exercise, weight control and appropriate supplementation.

Are Our Healthy Years Getting Shorter?

What Does This Mean For You?

Author: Dr. Stephen Chaney

If you’ve ever traveled the subway system in London, you can’t have missed the “Mind the Gap” signs warning not to put your foot in the gap between the subway and the platform.

That warning is more important than ever in an age where people look at their cell phones rather than where they are walking. Of course, if they are looking at their cell phones, they might miss the sign and…

But today’s “Health Tip” is not about subway gaps. It’s about a far more important gap – the gap between our healthspan (how many years we enjoy good health) and our lifespan (how many years we live).

A recent study (L Gimeno et al, The Journals of Gerontology, Series B, 79(8), gbae113, 2024) suggesting that our healthy years are getting shorter caught my attention.

All of us imagine that our golden years will be ones of vibrant health. We’ll travel to exotic places. We’ll take long walks in the mountains. We’ll play with our grandchildren. Life will be wonderful.

But if this study is correct, none of that will happen for many young Americans. They will be too frail and sick to enjoy their golden years. They will be surviving rather than thriving.

So, in today’s “Health Tips From the Professor” I will review the study and tell you what it means for you.

How Was The Study Done?

clinical studyThe investigators used data on 114,526 adults >50 (average age = 63) from developed countries (the United States, England, and continental Europe). Specifically, they used data from people who participated in the Healthy and Retirement Study (26,939 people in the United States), the English Longitudinal Study on Ageing (14,992 people in England), and the Survey of Health, Ageing, and Retirement (72,595 people in continental Europe) between 2004 and 2018.

These surveys collected data on health-related outcomes every 2 years. The outcomes measured were:

  • Six activities of daily living (ADLs) such as eating, bathing, and walking.
  • Four instrumental activities of daily living (IADLs) related to essential tasks such as grocery shopping or preparing a hot meal.
  • Seven measures of mobility difficulties and motor coordination tasks such as walking one block, lifting 10 pounds, or picking up a small coin from a flat surface.

The assumption was that the severity of limitations was ADL > IADL > mobility difficulties. This is based on previous research showing that a person with ADL limitations is likely to have IADL limitations and mobility difficulties. And a person with IADL limitations is likely to have mobility difficulties. Based on this assumption, they classified participants in this study into 4 disability categories:

  • Mild disability: ≥1 IADL limitations and any number of mobility difficulties.
  • Moderate disability: 1-2 ADL limitations with any number of IADL limitations and mobility difficulties.
  • Severe disability: ≥3 ADL limitations with any number of IADL limitations and mobility difficulties.

The study also measured the prevalence (percent of the population) with:

  • Obesity
  • Heart disease.
  • Diabetes
  • Cancer
  • Lung disease.
  • High blood pressure.
  • High cholesterol.

Finally, the study also measured grip strength because loss of grip strength is considered an indicator of future disabilities.

The unique feature of this study is it compared the health and disability of people who were at the same age when tested but were born in different decades ranging from 1925 to 1955.

Because of the rapid change in diet and lifestyle following World War II, the health and disability of people born in the 1936-1945 decade encompassing World War II was used as the standard to which all other decades were compared.

Are Our Healthy Years Getting Shorter?

Some of you may have skipped over the previous section, so I will repeat the way these data were analyzed because it is crucial to your understanding of the study.

“The unique feature of this study is it compared the health and disability of people who were at the same age when tested but were born in different decades ranging from 1925 to 1955.

Because of the rapid change in diet and lifestyle following World War II, the health and disability of people born in the 1936-1945 decade encompassing World War II was used as the standard to which all other decades were compared.”

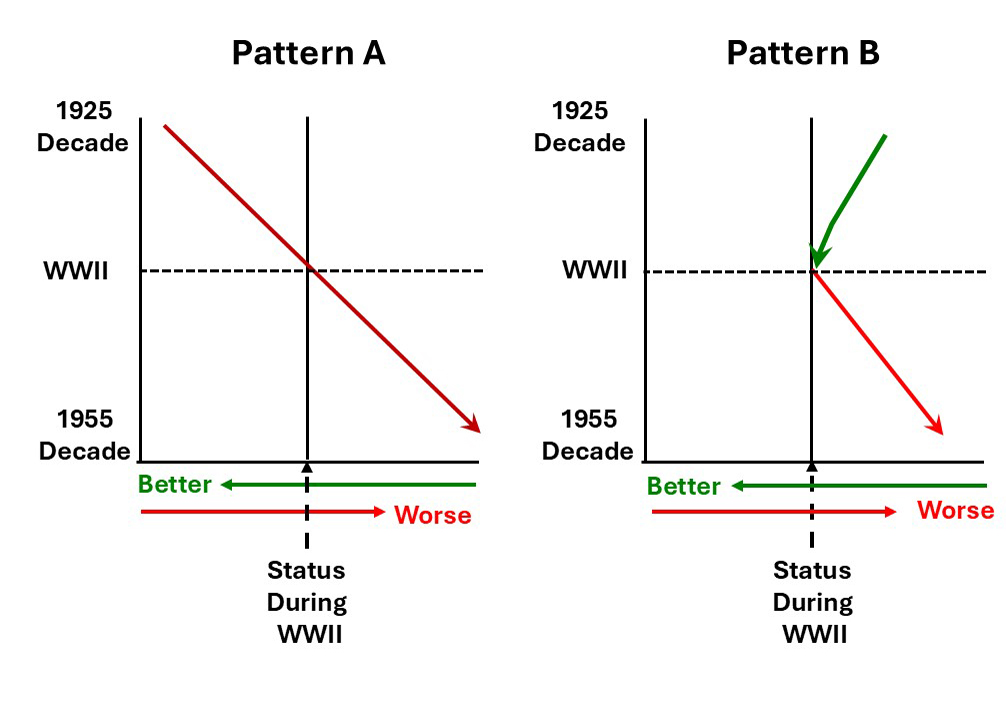
When looking at data from the United States, there were two distinct patterns.

The vertical line in the center of the graph represents the health and disability status of people born during World War II because all comparisons in this study were to people born in the decade encompassing World War II. A worsening of health and disabilities is indicated in red and an improvement in health and disabilities is shown in green. 

Pattern A was characteristic of a constant worsening of health and disabilities from people born in the decade starting in 1925 to people born in the decade starting in 1955.

This pattern was seen for:

  • Obesity
  • Heart disease.
  • Diabetes
  • Lung disease.
  • High blood pressure.
  • High cholesterol.
  • Severe disabilities.
  • Reduction in grip strength.

Remember, this study is measuring health and disability of people at the same age. The only difference is when they were born. It tells us people in their 50s, 60s, or 70s born in 1955 or later are in poorer health than people of the same age who were born in 1925.

And it’s not just the United States. For obesity and health parameters the pattern was the same for England and Europe. For severe disabilities the pattern was the same for England but was not as clear for Europe.

Two things should be noted for this pattern:

  • The worsening of health and the increase in severe disabilities comes despite the vast improvements in the health care systems in these countries and improved understanding of the causes of these diseases.
  • Obesity is likely a major driver of our declining health and increased disability. However, it is not the only driver. If the investigators had graphed the percentage of highly processed foods in the diet or the decline in regular exercise, the pattern would have been similar.

Pattern B shows an improvement in the period leading up to World War II and a deterioration in the period after World War II. The authors interpreted the improvement prior to World War II as due to improvements in health care and the deterioration after World War II as due to changes in diet and lifestyle.

This is the pattern seen for mild and moderate disabilities in the United States. The pattern for mild and moderate disabilities was not as clear for England and Europe.

The authors concluded, “In all regions, we found evidence for worsening health across cohorts [groups of people born in successive decades], particularly for those born after 1945.”

What Does This Study Mean For You?

QuestionsI don’t want to overinterpret this study. This study breaks new ground, but it has some limitations that I would characterize with three statements:

  • It is a very difficult study to do perfectly.
  • There are several factors that could affect the interpretation of the data and the outcome of the study.
  • The authors made a valiant effort to correct for any factors that could have affected the outcome.

For more details about the factors that might affect the outcome of the study and how the authors corrected for them, read the study.

However, this is the first study to use this approach to gauge the decrease in healthy years (healthspan) in developed countries over the past 40 years. It has its flaws, but it is consistent with several other studies documenting declining health in the current generation of young adults. For example, in a recent issue of “Health Tips From the Professor” I reviewed a study showing that colon cancer rates are increasing at an alarming rate for young adults in this country.

At the beginning of this article, I talked about the gap between our healthspan (how many years we enjoy good health) and our lifespan (how many years we live).

This study suggests that the onset of significant health issues and disabilities is occurring at a younger age today than for people born before World War II. In short, it suggests that our healthspan (the number of healthy years) is getting shorter.

This study did not look at lifespan, but numerous studies show that our lifespan is still increasing. So, the gap between healthspan and lifespan appears to be getting larger. In simple terms this means that when today’s young adults reach their “golden years”, they may spend more of those years in poor health than those of us born in the 1940’s.

But, what does this mean for you? The take home lesson should be, “This doesn’t have to be. You don’t have to be frail and sickly in your golden years. We know how to prevent this.”

  • It starts with a healthy diet – a whole food, primarily plant-based diet with lots of colorful fruits and vegetables, whole grains, nuts and seeds.
  • Add in a regular exercise program with a mixture of aerobic and resistance exercises.
  • Include an individualized supplement program.

You notice I didn’t list weight control as one of the top three prevention strategies. That’s because I don’t recommend fad diets and rapid weight loss programs. If you do the first three things well, your weight will come off naturally – a little bit at a time.

And once you have mastered all four things, you will increase your healthy years and narrow the gap between your healthspan and your lifespan. You can look forward to golden years filled with vitality and adventure.

The Bottom Line

A recent study used an innovative approach to quantify the deterioration in health and the physical ability to function well in daily activities as we age. The unique feature of this study is it compared the health and disability of people who were at the same age when tested but were born in different decades ranging from 1925 to 1955.

The study found a constant worsening of health and disabilities from people born in the decade starting in 1925 to people born in the decade starting in 1955 for:

  • Obesity
  • Heart disease.
  • Diabetes
  • Lung disease.
  • High blood pressure.
  • High cholesterol.
  • Severe disabilities.

The authors concluded, “We found evidence for worsening health across cohorts [groups of people born in successive decades], particularly for those born since 1945.”

In short, people born in recent years have fewer healthy years (a shorter healthspan) than people born before World War II. And since our lifespans are getting longer, this means the gap between our healthspan and our lifespan is increasing.

All of us imagine that our golden years will be ones of vibrant health. We’ll travel to exotic places. We’ll take long walks in the mountains. We’ll play with our grandchildren. Life will be wonderful.

But if this study is correct, none of that will happen for many of today’s young adults. They will be too frail and sick to enjoy their golden years.

For more details about this study and how you can increase your healthy years, narrow the gap between your healthspan and your lifespan, and look forward to golden years filled with vitality and adventure, read the article above.

These statements have not been evaluated by the Food and Drug Administration. This information is not intended to diagnose, treat, cure, or prevent any disease.

 ______________________________________________________________________________

My posts and “Health Tips From the Professor” articles carefully avoid claims about any brand of supplement or manufacturer of supplements. However, I am often asked by representatives of supplement companies if they can share them with their customers.

My answer is, “Yes, as long as you share only the article without any additions or alterations. In particular, you should avoid adding any mention of your company or your company’s products. If you were to do that, you could be making what the FTC and FDA consider a “misleading health claim” that could result in legal action against you and the company you represent.

For more detail about FTC regulations for health claims, see this link.

https://www.ftc.gov/business-guidance/resources/health-products-compliance-guidance

_______________________________________________________________________

About The Author 

Dr. Chaney has a BS in Chemistry from Duke University and a PhD in Biochemistry from UCLA. He is Professor Emeritus from the University of North Carolina where he taught biochemistry and nutrition to medical and dental students for 40 years.  Dr. Chaney won numerous teaching awards at UNC, including the Academy of Educators “Excellence in Teaching Lifetime Achievement Award”. Dr Chaney also ran an active cancer research program at UNC and published over 100 scientific articles and reviews in peer-reviewed scientific journals. In addition, he authored two chapters on nutrition in one of the leading biochemistry text books for medical students.

Since retiring from the University of North Carolina, he has been writing a weekly health blog called “Health Tips From the Professor”. He has also written two best-selling books, “Slaying the Food Myths” and “Slaying the Supplement Myths”. And most recently he has created an online lifestyle change course, “Create Your Personal Health Zone”. For more information visit https://chaneyhealth.com.

For the past 45 years Dr. Chaney and his wife Suzanne have been helping people improve their health holistically through a combination of good diet, exercise, weight control and appropriate supplementation.

Is Fast Food Fat Food?

Fat Metabolism Simplified 

Author: Dr. Stephen Chaney 

If you are like most Americans, you have vowed to lose weight and/or gain health in 2023. But how do you do that? There are hundreds of diets to choose from. And each diet has its “story” – a mixture of pseudo-science and testimonials – designed to convince you to try it.

Forget the pseudo-science. Forget the testimonials. Instead, focus on the one thing these diets have in common. They are all whole food diets. They all eliminate sodas, fast foods, and highly processed convenience foods.

In fact, that may be the simplest thing you can do to lose weight and become healthier. Many experts say that any time you eliminate sodas, fast foods, and convenience foods you will lose weight. If that statement is true, it could explain the American obesity epidemic. Between 1977 and 2017, a span of just 40 years, fast food consumption:

  • Increased from 6% to 35% (a 6-fold increase) in the 40-65 age group, and…
  • 11% to 46% (a 4-fold increase) in the 12-39 age group.

But is it true? There are certainly reasons to think it might be:

  • Fast foods are high in fat, sugar, and calories and are low in fiber – all of which are associated with obesity.
  • Big Food Inc has researched the ideal combination of taste, mouth feel, and effect on blood sugar to create an addiction to fast food.

However, the studies linking fast food consumption to obesity have been flawed.

  • People who consume fast foods tend to exercise less and have a poorer diet, even when they are eating at home. Previous studies have not distinguished between fast food consumption and other things (diet, exercise, lifestyle) that are also linked to obesity.
  • Previous studies have often only assessed diet and other lifestyle factors at the beginning or end of the study. There is no way of knowing whether these values are typical for the entire timespan of the study.
  • Previous studies have only shown associations, not cause and effect.

The current study (AO Odegaard et al, American Journal of Clinical Nutrition, 116: 255-262, 2022) was designed to eliminate many of the flaws in previous studies.

Fat Metabolism Simplified

You have probably heard that belly fat increases your risk of diabetes, heart disease, stroke, Alzheimer’s, and some cancers. This study looked at the effect of fast foods on belly fat, muscle fat, and fatty liver (liver fat).

However, belly fat is both simple and complicated:

  • It is simple in that it is easy to see. We talk about it as an “apple shape” and we measure it in waste circumference.
  • It is complicated because, anatomically, there are several subtypes of belly fat, and these authors chose to examine the effect of fast foods on each subtype.
  • However, the effect of fast foods on each subtype of belly fat, and the metabolic effects of each subtype, are similar. So, in the interest of simplicity, I will combine the subtypes and simply refer to the effect of fast foods on belly fat.

With that in mind, here is all you need to know about biology and metabolism of fat.

In addition to fat accumulation in the abdomen (belly fat), this study also looked fat accumulation in muscle (which I will refer to as muscle fat) and liver (which I will refer to as liver fat).

All three types of fat contribute to metabolic syndrome (prediabetes) characterized by:

  • Insulin resistance, which leads to an elevation of both glucose and insulin.
  • High LDL (bad cholesterol) and low HDL (good cholesterol).
  • High triglycerides.
  • High blood pressure.
  • Inflammation

These metabolic effects increase the risk of diabetes, heart disease, stroke, Alzheimer’s, inflammatory diseases, and some cancers.

In addition, liver fat can lead to non-alcoholic liver disease, fibrosis of the liver, and cirrhosis of the liver.

How Was This Study Done?

clinical studyThis study recruited 5115 participants from the Coronary Risk Development in Young Adults (CARDIA) study. This study recruited young adults (average age of 25) in 1985-1986 and followed them for 25 years. The participants were 57% female and 53% white.

As stated above, this study looked at the effect of fast foods on belly fat, muscle fat, and fatty liver (liver fat).

This study had numerous strengths:

  1. Unlike many other studies, variables like diet, fast food intake, and lifestyle were measured at multiple times during the study.
    • All participants entered treatment centers for physical exams, bloodwork, and lifestyle questionnaires at entry into the study (year 0) and again at years 2, 5, 7, 10, 15, 20, and 25.
    • On years 0, 7, 10, 15, 20, and 25 the questionnaires included the question, “How many times in a week or month do you eat breakfast, lunch, or dinner out in a place such as McDonald’s, Burger King, Wendy’s, Arby’s, Pizza Hut, or Kentucky Fried Chicken?” This question was used to calculate the number of times per week that participants ate fast food meals.
    • On years 0, 7, and 10 the quality of the non-fast-food portion of their diet was assessed by asking the participants to complete a comprehensive questionnaire about their typical intake of foods over the past month.
      • Diet quality was calculated using something called an alternative Mediterranean diet score because this calculation excludes foods commonly consumed at fast food restaurants. Thus, this calculation specifically measures the quality of the non-fast-food portion of their diet.
    • Each of these variables was averaged over the entire timespan of the study and trends (either an increase or decrease over time) were noted.
    • The outcomes of the study (belly fat, muscle fat, and liver fat) were measured at the end of the study (year 25) using CT imaging techniques.

2) The authors identified other factors that may have caused fat accumulation and corrected for them. For example:

    • Participants with the highest fast food consumption had lower educational level, lower income, poorer non-fast-food diet quality, lower physical activity, lower alcohol intake, higher caloric intake, and were more likely to be male and black.
    • Consequently, the data comparing fast food intake with fat accumulation were corrected for age, sex, race, education, income, smoking, alcohol, diet quality, caloric intake, and physical activity.

Is Fast Food Fat Food?

Fast food intake was equally divided into quintiles ranging from “Never to once a month” to “≥ 3 times per week”. When participants with the highest fast food intake over the past 25 years were compared to those with the lowest:

  • Their belly fat was higher by 48%.
  • Their muscle fat was higher by 27%
  • Their liver fat was 5-fold higher.
  • Their waist circumference (another measure of belly fat) was 11% (4 inches) more.
  • Their BMI (a measure of obesity) was 15% higher.

The authors concluded, “The results of this analysis robustly demonstrate that middle-aged adults who ate fast food more frequently over the past 25 years have significantly higher odds of MAFLD [fatty liver disease] and IAAT [belly fat]…aligned with poorer current and future cardiometabolic health [heart disease and diabetes] and chronic disease risk.”

What Does This Study Mean For You?

Several previous studies have shown that fast food consumption leads to fat accumulation and/or obesity. However, this is perhaps the best designed study on the effect of fast foods on fat accumulation and obesity to date. This is because:

  • It measured fast food consumption, non-fast-food diet quality, exercise, and many other lifestyle factors at multiple times during the 25-year study. That way we can be assured we are looking at fast food consumption and other lifestyle choices over the entire 25-year timespan of the study, not just at the beginning or end of the study.
  • The authors corrected the data for other lifestyle factors known to influence fat accumulation and obesity. Statistical corrections are never perfect, but these authors did their best to make sure the study only measured the effects of fast food consumption on fat accumulation.

Of course, this kind of study shows associations. It does not prove cause and effect. However, since 25-year double blind, placebo-controlled studies are not possible, this is perhaps the best study we may ever have.

That brings me back to your New Year resolutions. If you are like most Americans, you have probably resolved to lose weight and get healthier in past years – only to end the year fatter and less healthy than you started it.

You have probably tried dozens of diets. They worked for a while, but they were difficult to follow long term, and eventually you abandoned them.

My suggestion this year is to forget the crazy diets. Just go for a simple change. Eliminate sodas, fast foods, and convenience foods from your diet. You will lose weight. And you will be healthier. Guaranteed.

Of course, it’s not that simple. Remember that Big Food Inc has designed these foods to be addictive. Unless you have an iron will, you probably won’t be able to go cold turkey.

You may need a gradual approach. Replace sodas, fast and convenience foods one at a time. Find healthier substitutes for each fast food you replace. Then explore more convenient ways to eat healthy. It will be a journey. But the end results will be worth it.

The Bottom Line 

If you are like most Americans, you have vowed to lose weight and/or gain health in 2023. But how do you do that? There are hundreds of diets to choose from. And each diet has its “story” – a mixture of pseudo-science and testimonials – designed to convince you to try it.

Forget the pseudo-science. Forget the testimonials. Instead, focus on the one thing these diets have in common. They are all whole food diets. They all eliminate sodas, fast foods, and highly processed convenience foods.

Many studies have implicated sodas, fast and convenience foods in obesity and fat accumulation in our bodies. But these studies have all had their flaws.

A recent study looked at the association between fast food intake and 3 kinds of fat (belly fat, muscle fat, liver fat) over 25 years. All 3 kinds of fat are highly associated with metabolic syndrome (prediabetes) and several chronic diseases. More importantly, this study was designed to eliminate many of the flaws in previous studies.

When participants with the highest fast food intake over the past 25 years were compared to those with the lowest:

  • Their belly fat was higher by 48%.
  • Their muscle fat was higher by 27%.
  • Their liver fat was 5-fold higher.
  • Their waist circumference (another measure of belly fat) was 11% (4 inches) more.
  • Their BMI (a measure of obesity) was 15% higher.

The authors concluded, “The results of this analysis robustly demonstrate that middle-aged adults who ate fast food more frequently over the past 25 years have significantly higher odds of MAFLD [fatty liver disease] and IAAT [belly fat]…aligned with poorer current and future cardiometabolic health [heart disease and diabetes] and chronic disease risk.”

Simply put, the best thing you can do for your weight and your health this year is to eliminate sodas, fast foods, and convenience foods from your diet. You will lose weight. And you will be healthier. Guaranteed.

For more details on this study, read the article above.

These statements have not been evaluated by the Food and Drug Administration. This information is not intended to diagnose, treat, cure, or prevent any disease.


Does Processed Food Give You Gas?

Why Does Processed Food Give You Gas?

Author: Dr. Stephen Chaney 

Does it feel like a war is going on in your belly every time you eat? It could be IBD (inflammatory bowel disease). IBD can take several forms, but the two most common are Crohn’s disease and ulcerative colitis.

What do we know about IBD?

  • The symptoms of IBD can make you miserable. They include:
    • Abdominal pain and cramping.
    • Diarrhea with occasional bouts of constipation.
    • Gas and bloating.
    • Loss of appetite and/or unexpected weight loss.
  • There are about 1.6 million Americans with IBD and 70,000 new cases/year.
    • The prevalence of IBD in the United States has increased by 34% between 2006 and 2016.
  • As you might suspect from its name, IBD is a chronic inflammation of the gastrointestinal tract.
    • It is thought to be caused by “dysbiosis of the gastrointestinal track” (In layman’s terms that means damage to your intestine caused by too many bad bacteria and not enough good bacteria).
    • There is also a genetic component to the disease. Some people are much more susceptible to IBD than others.

If you watch TV, you know that there are drugs for treating IBD. The ads make them sound like miracle drugs. But if you listen carefully, you also know that these drugs have a long list of side effects. And some of the side effects are pretty scary.

Are There Natural Approaches For Controlling IBD?

BacteriaSo, if your belly is a bit rumbly, you might be wondering if there is a more natural approach you could take. We know that diet affects the balance between bad and good bacteria in our intestine. Could something as simple as changing your diet, quell the fire in your belly?

While the answer seems obvious, it has been hard to prove. The results of previous studies have been inconclusive. That is because previous studies:

  • Included too few people. 1.6 million people in the US with IBD may sound like a lot, but that represents only 0.4% of the population. Unless you have a really big study, there won’t be enough people who develop IBD to give you statistically significant results.
  • Were too short. IBD doesn’t develop overnight.
  • Did not include a diverse enough population. Previous studies were confined to individual countries or specific regions within a country.

This study (N Narula et al, British Medical Journal, 2021;374:n1554) was designed to overcome the limitations of previous studies. It also looked at the effect of diet on IBD from a different perspective than most previous studies.

  • It did not focus on the effect of individual foods on IBD. Since consumption of processed foods is known to affect the population of intestinal bacteria, the authors of this study asked whether processed food consumption might influence the likelihood of developing IBD.

How Was The Study Done?

Clinical StudyThe authors of this study used data collected from the PURE (Prospective Urban Rural Epidemiology) study between January 1, 2003, and December 31, 2016. The PURE study collected data from a very diverse population. Specifically, it collected data from 21 low-, middle-, and high-income countries across 7 geographical regions (Europe, North America, South America, Africa, Middle East, South Asia, Southeast Asia, and China).

  • This study followed 116,087 adults aged 35-70 years (average age 50, percent women = 60%) in the PURE study for an average of 9.7 years. During that time, 467 participants (0.4%) developed IBD.
  • All participants filled out a baseline food-frequency questionnaire that had been designed and validated for foods specific to their country.
  • Participants were asked if they had a diagnosis of Crohn’s disease or ulcerative colitis as part of an annual follow-up questionnaire. To assure the accuracy of these answers they were validated with medical records whenever possible.

Does Processed Food Give You Gas?

Does processed food give you gas? Does it give you abdominal pain, diarrhea, and bloating? In short, does it give you IBD? That is the question this study was designed to answer. Here are the results of the study:

  • When comparing those eating the most processed food (≥5 servings/day) to those consuming the least (≤1 serving/day), processed food consumption increased the risk of developing IBD by 1.82-fold. This finding was equally true for:
    • Both Crohn’s disease and ulcerative colitis.
    • Adults <50 and adults >50.
    • Every region of the world included in the PURE study.
  • When the investigators looked at different categories of processed foods:
    • Processed meat intake increased the risk of IBD by 2.07-fold.
    • Soft drink intake increased the risk of IBD by 1.94-fold.
    • Refined sweetened food intake increased the risk of IBD by 2.58-fold.
    • Salty food and snack intake increased the risk of IBD by 2.06-fold.
  • When the investigators looked at different categories of unprocessed foods:
    • White meat, red meat, dairy, starchy foods, fruits, vegetables, and legumes had no effect on the risk of developing IBD.
    • Sodium intake (as measured by urinary excretion of sodium) also had no effect on the risk of developing IBD.

Why Does Processed Food Give You Gas?

Question MarkYou may be wondering why does processed food give you gas – and other symptoms of IBD.

The simplest explanation is that whole grains, unprocessed fruits & vegetables, and legumes provide the fiber that supports the growth of friendly gut bacteria. Processed foods displace these foods from our diet.

But these investigators think something else about processed foods may be contributing to the increased risk of IBD. That is because in their study:

  • Processed meat increased the risk of IBD, but unprocessed white and red meat had no effect on IBD.
  • Processed sweetened foods increased the risk of IBD, but unprocessed starchy foods and naturally sweet fruits had no effect on IBD.
  • Processed salty foods and snacks increased the risk of IBD, but sodium intake had no effect on IBD.

The investigators also noted that in mouse studies:

  • Some food additives found in processed foods cause bacteria to stick to the epithelial lining of the intestine and/or cause leaky gut syndrome, both of which can lead to chronic inflammation of the intestine.

The investigators concluded, “In this study, higher ultra-processed food intake was associated with a higher risk of IBD.”

They went on to say, “As white meat, unprocessed red meat, dairy, starchy foods, fruits, vegetables, and legumes were not found to be associated with development of IBD, this study suggests that it may not be the food itself that confers this risk but rather the way the food is processed or ultra-processed…Further studies are needed to identify specific potential contributing factors among processed foods that might be responsible for the observed associations in our study.”

[Note: This is a fancy way of saying that the detrimental effects of processed foods may be due to more than the fact that they displace healthier foods from the diet. It may also be due to the effect of food additives on the risk of developing IBD.]

What Does This Study Mean For You?

Questioning WomanIBD is a rare disease (0.4% of the population). If you don’t have digestive issues, it would be easy to ignore this study and continue with a diet of highly processed foods.

However, I would remind you that in recent issues of “Health Tips From the Professor”, I have shared recent studies showing that highly processed foods increase your risk of:

And these studies are just the tip of the iceberg. We know that diets rich in whole grains and unprocessed fruits and vegetables decrease the risk of heart attack, stroke, and Alzheimer’s disease. And a diet rich in whole grains, fruits, and vegetables is the antithesis of a processed food diet.

The evidence is overwhelming. Highly processed foods may be convenient and tasty. But if you value your health, they are not your friends.

The Bottom Line 

A recent study looked at the effect of consuming processed foods on the risk of developing inflammatory bowel disease (IBD). The study found:

  • When comparing those eating the most processed food (≥5 servings/day) to those consuming the least (≤1 serving/day), processed food consumption increased the risk of developing IBD by 1.82-fold. This finding was equally true for:
    • Both Crohn’s disease and ulcerative colitis.
    • Adults <50 and adults >50.
    • Every region of the world included in the study.

The investigators concluded, “In this study, higher ultra-processed food intake was associated with a higher risk of IBD.”

They went on to say, “…This study suggests that it may not be the food itself that confers this risk but rather the way the food is processed or ultra-processed…Further studies are needed to identify specific potential contributing factors among processed foods that might be responsible for the observed associations in our study.”

[Note: This is a fancy way of saying that the detrimental effect of processed foods may be due to more than the fact that they displace healthier foods from the diet. It may also be due to the effect of food additives commonly found in processed foods on the risk of developing IBD.]

For more details on the study and what it means for you, read the article above.

These statements have not been evaluated by the Food and Drug Administration. This information is not intended to diagnose, treat, cure, or prevent any disease.

Can You Lose Weight Without Going On A Diet?

8 Tips For Eating Less

Author: Dr. Stephen Chaney 

New Year DietYou have just made your New Year’s resolutions, and weight loss is probably near the top of the list. You may be considering the latest new diet fad – never mind that you’ve tried lots of diets in the past and have always regained the weight you lost.

Perhaps the very thought of going on a diet terrifies you. You are tired of struggling to follow strict “rules” and forgoing all your favorite foods. You are tired of constantly being hungry.

What if you could lose weight without going on a diet? What if you could learn just a few tricks that would help you eat less every day? Would that be of interest to you? Do you think it might help you lose some weight and keep it off?

This week I’m going to share 8 tips for eating less every single day from Professor Brian Wansink of Cornell University. He is Director of their Food and Brand Lab. He has devoted his career to studying how external clues influence our eating patterns. He is the author of the best-selling books “Mindless Eating” and “Slim by Design”. He is the world expert on this topic.

A few years ago, I had the pleasure of attending a seminar he gave. Here’s a quick summary of what I learned.

8 Tips For Eating Less

Tip #1: The Size Of The Container Matters

Popcorn bagsIn one of his research studies he gave moviegoers who had just eaten dinner either a big bag or a small bag of stale popcorn. Those given the big bag ate 34% more. Think about that for a minute. The subjects in his study weren’t hungry. They had just eaten dinner. The popcorn wasn’t particularly tasty. It was stale. Yet they ate 34% more based solely on the size of the bag!

The take home lesson is always to choose the smallest container when given a choice. This is also why you want to serve your meals on small plates and drink your beverages in small glasses or cups. If you want to snack while you watch TV, place your snack food in a very small container and store the rest out of sight.

Tip #2: Don’t Fall For Marketing Hype

He was asked to consult for a cafeteria serving health food because they weren’t attracting enough customers. He just advised them to change the names of their menu items (e.g. “Succulent Tuscany Pasta” instead of “Italian Pasta”). Sales increased by 27%.

The take home lesson is not to fall for the marketing hype. Restaurants and food manufacturers know all the tricks. They know how to make even ordinary foods sound delicious. Make your food choices based on the ingredients of the food, not on the marketing description.

Tip #3: Make Junk Food InconvenientCandy Dish

In another study he put clear glass dishes of candy either on a secretary’s desk or 6 feet away on a cabinet. The secretaries consumed 125 more calories/day from candy when it was on their desk. Think about that for a minute. 125 excess calories/day could amount to around one pound of weight gain/month, 12 pound/year, 60 pounds every 5 years, and a whopping 120 pounds over 10 years!

The take home lesson is to make high calorie snacks and junk foods inconvenient. Put them in the back of your refrigerator, on the top shelf of your cabinets, or other out of the way places. Even better, don’t bring them home in the first place.

Tip #4: Watch The Refills.

When he used a refillable soup bowl (it never goes below half full) people ate 73% more soup than those given a regular bowl of soup. When he asked the people with the refillable bowl if they were full, they replied “How could I be? I only ate half a bowl of soup”.

Of course, most of us will never experience a refillable soup bowl. However, if you are having a meal with friends and enjoying the conversation, it is easy to ignore the refills – either from your waiter at a restaurant or your favorite aunt at a family gathering.

Tip #5: Low Fat Doesn’t Mean “Eat More”

lowfatWhen he took a batch of trail mix and labeled some as “low fat” and some as “regular” people ate 21% to 46% more calories of the “low fat” trail mix. This was not an idle exercise. In fact, many low fat foods aren’t low calorie, but people assume that they are and use that as an excuse to eat more.

The take home lesson is to not assume you can eat more just because a food is labeled low fat, gluten free or some other healthy sounding description. In many cases, it has just as many calories as the full fat version. Even if it is, in fact, lower in calories, the only way you benefit from the reduced calories is when you consume the same portion size as you would for the full fat food it replaces.

Tip #6: Health Foods Are Not Necessarily Healthy

When he showed people an Italian sandwich and told them that it was from either “Jim’s Hearty Sandwich Shop” or from “Good Karma Healthy Foods”, people estimated the calories as 24% lower if they thought it came from Good Karma.

The take home lesson is that health foods are not necessarily healthier. Food manufactures know that health food is in, and they market their products accordingly. If you walk down the aisles of your favorite health food store, you will find “health” foods that are just as high in sugar, fat and calories as the junk food you can buy at the convenience store down the street. They may contain “natural” fats and sugars, but those have just as many calories as the “unhealthy” fats and sugars in the junk foods. You still need to read labels and choose unprocessed fruits, vegetables and whole grains whenever possible.

Tip #7: Don’t Call It ExerciseNature Walk

When he took students on a walk around a lake before dinner, they ate more calories at dinner if they were told that it was an exercise walk than if they were told that it was a sight-seeing walk – and most of the extra calories came from dessert. Think about that for a minute. It is a human tendency to reward ourselves for virtuous behavior, but when that reward involves eating, it becomes self-defeating.

The take home lesson is two-fold.

  • Reframe our virtuous behavior. If we call it exercise or a work-out, it implies that we have done something virtuous and deserve a reward. If we call it a nature walk or think of it as a sport, it becomes its own reward. If we think of substituting a salad for a dinner of fried chicken and mashed potatoes with gravy as virtuous behavior, we may think we deserve a dessert as a reward. If we think of the salad as a gourmet experience, it can become a reward in its own right.
  • Rethink our rewards. The reward doesn’t need to be food related. It could involve reading a book, watching a show, or whatever you favorite activity might be.

Tip #8: Knowing This Stuff Isn’t Enough.

The fascinating thing is that his research shows it doesn’t matter how intelligent or well informed you are.

He did a study with 60 graduate students. Just before winter break, he gave them a lecture on external eating cues in which he specifically told them that they would eat more from a big bowl of Chex Mix than from a small bowl. The students then spent 90 minutes in small group exercises designed to show them how to overcome external eating cues.

After winter break he invited those same students to a Super Bowl party in which he divided them into two rooms and gave them, you guessed it, either large or small bowls of Chex Mix. The ones given the large bowls ate 53% more!

He later gave the same lecture to a meeting of The American Diabetes Association (Those are the experts) and then repeated the same experiment with them – and they still ate more from the large bowls.

Can You Lose Weight Without Going On A Diet?

Question MarkThat brings us back to the original question, “Can you lose weight without going on a diet?” You can start by decreasing the amount of food you eat.

Dr. Wansink’s research clearly shows that overeating is mindlessly dependent on external eating cues, AND that you can’t avoid being influenced by those external clues even if you are intelligent and motivated! So what can you do?

Dr. Wansink recommends planning ahead. For example:

  • Serve your food on small plates and don’t leave food lying around where you can see it or get to it easily.
  • If you bring home a box or bag of snack food (hopefully healthy snack food), divide it up into healthy portion sizes as soon as you bring it home.
  • Put the healthy food choices in the front of your refrigerator or cupboard where you will see them easily and hide the unhealthy foods in the back (or don’t bring them home to begin with).

However, the most important thing is to realize most of this behavior is mindless. It is not enough to simply understand these external eating cues at an intellectual level. We need to be constantly vigilant for external eating cues, or we will find ourselves overeating without really understanding why.

Hopefully, these tips will help you eat less and attain a healthier weight next year than you did this year. However, these 8 tips are just the tip of the iceberg. If this article has piqued your interest and you’d like to learn more, I recommend you read one of Dr. Wansink’s books.

Finally, for best results I recommend that you also:

  • Make healthier food choices.
    • Whole unprocessed or minimally processed foods have a lower caloric density than the highly processed foods most of us eat.
    • People eating whole food, primarily plant-based diets generally weigh less than people eating the typical American diet or meat-based low carb diets.
    • Don’t overwhelm yourself. Simply substitute one healthy food choice for one unhealthy food choice every week or so. There are no “rules”. You choose which substitutions you want to make and how often you want to make them.
  • Exercise more.
    • Just don’t call it exercise. If you look forward to your sport, dance, etc., you are more likely to keep doing it.

The Bottom Line

If you are like most people. You want to lose weight but dread going on another diet. What if you could lose weight without going on a diet? What if you could learn just a few tricks that would help you eat less every day?

  • Brian Wansink’s research has shown that overeating, to a large extent, is mindlessly dependent on external eating cues, and that you can’t necessarily avoid being influenced by those external clues even if you are intelligent and motivated!
  • I have distilled his research into 8 simple tips to help you eat less and attain a healthier weight next year than you did this year.

For more information and other suggestions for losing weight without going on a diet, read the article above.

These statements have not been evaluated by the Food and Drug Administration. This information is not intended to diagnose, treat, cure or prevent any disease.


Which Diet Is Best?

Tips For Loosing Weight And Keeping It Off

Author: Dr. Stephen Chaney

Diet season starts in just a few days! Like millions of Americans, you will probably be setting a goal to eat healthier, lose weight, or both. But which diet is best? Vegan, Paleo, Keto, 360, Intermittent Fasting, low-carb, low fat – the list is endless.

And then there are the commercial diets: Meal replacements, low calorie processed foods, prepared meals delivered to your door – just to name a few of the categories.

You can choose to count calories, focus on portion sizes, or keep a food journal.

And, if you really want to live dangerously, you can try the latest diet pills that claim to curb your appetite and rev up your metabolism.

The advertisements for all these diets sound so convincing. They give you scientific-sounding mumbo-jumbo to explain why they work. Then they talk about clinical studies they say prove their diet works.

If you are like most Americans, you have already tried several of these diets. They worked for a while, but the pounds came back – and brought their friends with them.

But, as the saying goes, “Hope springs eternal in the human breast. Surely some diet you haven’t tried yet will work for you.

There are such diets. But they will require effort. They will require a change of mindset. There is no magic wand that will chase the extra pounds away forever.

If you are searching for the perfect diet to start the new year, let me be your guide. Here are:

  • 4 tips on what to avoid and…
  • 6 tips on what to look for…

…when you are choosing the best diet for you.

What Should You Avoid When Choosing The Best Diet?

AvoidEndorsements.

Endorsements by your favorite athlete or public person are paid for. They don’t necessarily represent their opinion. Nor do they assure you that they follow that diet or use that diet supplement.

Endorsements by Dr. Strangelove and his buddies can be equally misleading. They usually tell you that the medical establishment has been lying to you, and they have discovered the “secret” to permanent weight loss and the “Fountain of Youth”.

Recommendations of the medical and scientific communities usually represent a consensus statement by the top experts in their field. I would choose their advice over Dr. Strangelove’s opinion any day.

2) Testimonials

Most of the testimonials you see online or in print are either paid for or are fake.

Testimonials by your friends can be equally misleading. We are all different. What works for your friend or your trainer may not work for you.

For example, some of us do better on low-carb diets, and others do better on low fat diets.

[Note: Some DNA testing companies claim they can sequence your DNA and tell you which diet is best. However, as I reported in a recent article in “Health Tips From The Professor”, independent studies show that DNA testing is of no use in predicting whether low-carb or low-fat diets are better for you.]

3) Diets Based on “Magic” Or “Forbidden” Foods or Food Groups.

I have often said we have 5 food groups for a reason. Each food group provides a unique blend of nutrients and phytonutrients. And each plant food group provides a unique blend of fibers that support the growth of different types of friendly gut bacteria.

The bottom line is that each of us does better with some foods than others, but there are no “magic” or “forbidden” foods that apply to everyone.

4) “Magic” Diets.

MagicI have written perhaps the first diet book, “Slaying The Food Myths”, that doesn’t feature a “magic” diet that is going to make the pounds melt away and allow you to live to 100. Instead, I recommend a variety of healthy diets and suggest you choose the one that fits you best.

However, I understand the allure of “magic” diets. Dr. Strangelove claims the diet will be effortless. He gives you some scientific-sounding mumbo-jumbo to convince you the diet is scientifically sound. Then he cites some clinical studies showing the diet will cause you to lose weight and will improve your health parameters (things like cholesterol, triglycerides, blood sugar, and blood pressure). It sounds so convincing.

Before you fall for Dr. Strangelove’s latest “magic” diet, let me share two things that may blow your mind:

    • The studies are all short-term (usually 3 months or less).
    • When you rely on short-term studies, the very low-fat Vegan diet and very low-carb Keto diet give you virtually identical weight loss and improvement in health parameters!

Those two diets are as different as any two diets could be. That means we can forget all the scientific-sounding mumbo-jumbo as to why each of those diets work. Instead, we should ask what these two diets have in common.

The answer is simple:

#1: The clinical studies are comparing “magic” diets to the typical American diet. Anything is better than the typical American diet! It is high in sugar, refined carbohydrates, saturated fat, and highly processed foods. No wonder the “magic” diets look so good.

#2: The diets are whole food diets. Anytime you eliminate sodas, fast foods, and highly processed foods, you will lose weight.

#3: The diets eliminate one or more food groups. Whenever you eliminate some of your favorite foods from your diet, you tend to lose weight without thinking about it. I call this the cream cheese and bagel phenomenon.

    • If you are following a low-fat diet, it sounds great to say you can eat all the bagels you want. But without cream cheese to go with the bagels, you tend to eat fewer bagels.
    • If you are following a low-carb diet, it sounds great to say you can eat as much cream cheese as you want, but without bagels to go with your cream cheese, you tend to eat less cream cheese.

#4: Because they eliminate many of your favorite foods, “magic” diets make you focus on what you eat. Whenever you focus on what you eat, you tend to lose weight. That is why food journals and calorie counters are effective.

#5: Finally, whenever you lose weight, your health parameters (cholesterol, triglycerides, blood sugar, and blood pressure) improve.

What Should You Look For In Choosing The Best Diet?

Skeptic1) Choose whole food diets. Avoid sodas, fast foods, and highly processed foods.

2) Choose primarily plant-based diets. These can range from Vegan through semi-vegetarian, Mediterranean, DASH, and Nordic. All are healthy diets. I have discussed the evidence for this recommendation in my book “Slaying The Food Myths”. Here is a brief summary.

When we look at long term (10-20 year) studies:

    • Vegetarians weigh less and are healthier than people consuming the typical American diet.
    • People consuming semi-vegetarian, Mediterranean, and DASH diets are healthier than people consuming the typical American diet.

If you look at low-carb diets:

    • People consuming plant-based low-carb diets weigh less and are healthier than people consuming the typical American diet.
    • People consuming meat-based low-carb diets are just as fat and unhealthy as people consuming the typical American diet.
    • The Atkins low-carb diet has been around for more than 50 years, and there is no evidence it is healthy long-term.

3) Choose diets that include a variety of foods from all 5 food groups. I have discussed the rationale for that recommendation above.

4) Choose diets that consider meat as a garnish, not a main course.

5) Choose diets that feature healthy carbs and healthy fats rather than low-carb or low-fat diets.

6) Think lifestyle, not diet. If you choose a restrictive diet so you can achieve quick weight loss, you will probably be just as fat and unhealthy next December 31st as you are this year. Instead, choose diets that teach healthy eating and lifestyle changes that you can make a permanent part of your life.

Tips For Losing Weight And Keeping It Off

You know the brutal truth. Around 95% of dieters regain everything they lost and then some within a few years. You have probably gone through one or more cycles of weight loss and regain yourself – something called “yo-yo dieting”. You may even be asking yourself if it is worth bothering to try to lose weight this year.

Rather focusing on the negative statistics of weight loss, let’s look at the good news. There are people who lose the weight and keep it off. What do they do?

There is an organization called the National Weight Control Registry that has enrolled more than 10,000 people who have lost weight and kept it off. The people in this group lost weight on almost every diet imaginable. However, here is the important statistic: On average people in this group have lost 66 pounds and kept it off for 5 years.

The National Weight Control Registry has kept track of what they have done to keep the weight off. Here is what they do that you may not be doing:

  1. They consume a reduced calorie, low fat diet.

2) They get lots of exercise (around 1 hour/day).

3) They have internalized their eating patterns. In short, this is no longer a diet. It has become a permanent part of their lifestyle. This is the way they eat without even thinking about it.

4) They monitor their weight regularly. When they gain a few pounds, they modify their diet until they are back at their target weight.

5) They eat breakfast on a regular basis.

6) They watch less than 10 hours of TV/week.

7) They are consistent (no planned cheat days).

Which Diet Is Best?

Now it is time to get back to the question you are asking right now, “Which diet is best?” I have covered a lot of ground in this article. Let me summarize it for you.

If you are thinking about popular diets:

  • Primarily plant-based diets ranging from Vegan to Mediterranean and Dash are associated with a healthier weight and better health long term.
    • If want to lose weight quickly, you may want to start with the more restrictive plant-based diets, like Vegan, Ornish, Pritikin or semi-vegetarian.
    • If you do better with a low-carb diet, my recommendation is the low-carb version of the Mediterranean diet.
    • If your primary goal is rapid weight loss, you could also start with one of the healthier of the restrictive low-carb diets, like the Paleo or the 360 diet. I do not recommend the Keto diet.
  • No matter what diet you start with, plan to transition to the primarily plant-based diet that best fits your lifestyle and food preferences. This is the diet you will want to stick with to maintain your weight loss and achieve better health long term.
  • Plan on permanent lifestyle change rather than a short-term diet. Otherwise, you are just wasting your time.
  • Eat whole foods. Big Food keeps up with America’s favorite diets and is only too happy to sell you highly processed foods that match your favorite diet. Avoid those like the plague.

If you are thinking about commercial diets featuring meal replacement products:

  • Look for meal replacement products that:
    • Do not contain artificial sweeteners, flavors, or preservatives.
    • Use non-GMO protein. A non-GMO certification for the other ingredients is not necessary. For a more detailed explanation of when non-GMO certification is important and when it is unnecessary, see my article) in “Health Tips From the Professor”.
    • Have stringent quality controls in place to assure purity. “Organic” and/or “non-GMO” on the label do not assure purity.
  • Look for programs that can provide clinical studies showing their diet plan is effective for weight loss and for keeping the weight off. Many programs have short-term clinical studies showing they are effective for weight loss, but very few have longer-term studies showing the weight stays off.
  • Finally, look for programs that teach permanent lifestyle change. This should include guidance on exercise and healthy eating.

I do not recommend most commercial diets that feature prepared low-calorie foods “shipped right to your door” as a major part of their program. The foods are highly processed. Plus, they include all your favorite unhealthy foods as part of the program. Even if they include lifestyle change as part of their program, they are undermining their message with the foods they are providing you.

I would be remiss if I didn’t mention that Weight Watchers is highly recommended by most experts in the field. Weight Watchers emphasizes journaling and counting calories, which is a plus because it makes you focus on what you are eating. They also have a good lifestyle program and support that can help you transition to permanent lifestyle change if you are willing to put in the effort. However, I don’t recommend their prepared low-calorie foods. They are no better than foods provided by the other commercial diet programs.

The Bottom Line 

Weight loss season is upon us. If you plan to lose weight and/or adopt a healthier diet in the coming year, you are probably asking, “Which Diet Is Best?” In this issue of “Health Tips From The Professor” I give you:

  • 4 tips on what to avoid when selecting the diet that is best for you.
  • 6 tips on how to choose the best diet.
  • 5 tips on what to look for when selecting a diet featuring meal replacement products.
  • 7 tips on how to keep the weight off.

Then I put all this information together to help you choose the best diet, the best meal replacement product, and/or the best commercial diet program.

For more details read the article above.

These statements have not been evaluated by the Food and Drug Administration. This information is not intended to diagnose, treat, cure or prevent any disease.


Can Artificial Sweeteners Make You Hungry?

Why Is There So Much Confusion About Artificial Sweeteners? 

Author: Dr. Stephen Chaney

Artificial SweetenersWhen artificial sweeteners were first introduced over 100 years ago, we were promised they would end obesity. We didn’t have to change our diets. We could just substitute calorie-free artificial sweeteners for sugar in all our favorite foods.

Since then, both consumption of artificial sweeteners and obesity have skyrocketed in this country. For example, in just the past 20 years:

  • The consumption of artificial sweeteners has increased by 54%, and…
  • The percentage of obese Americans has increased by 41%.

Today, over 40% of Americans are obese, and almost 10% of Americans are severely obese. That is a 4-fold increase since 1960!

Clearly, something isn’t working. Artificial sweeteners are not the magic solution we once thought they would be.

However, as I have told you before, association does not prove causation. Therefore, two important questions are:

  1. Are we consuming more artificially sweetened foods and drinks because more of us have become obese, or…

2) Do artificial sweeteners cause obesity?

Unfortunately, hundreds of clinical studies on this topic have not provided a definitive answer. For example, when we look at studies on diet sodas:

When the studies are tightly controlled by dietitians so that the people consuming diet sodas don’t add any extra calories to their diet, the results are exactly as expected. People consuming diet sodas lose weight compared to people drinking regular sodas.

However, the results are different in the real world where you don’t have a dietitian looking over your shoulder. In these studies, diet sodas are just as likely to cause weight gain as regular sodas.

As Barry Popkin, a colleague at the University of North Carolina, put it” “The problem is that we [Americans] areNo Fast Food using diet sodas to wash down our Big Macs and fries.” In short, people drinking diet sodas tend to increase their caloric intake by adding other foods to their diet. Even worse, the added foods aren’t usually fruits and vegetables. They are highly processed junk foods.

In other words, the suspicion is that artificial sweeteners may cause you to overeat. Various mechanisms for this effect have been proposed. For example, it has been proposed that artificial sweeteners may:

  • Increase your appetite.
  • Interfere with blood sugar control.
  • Increase your cravings for sweets.
  • Alter your gut bacteria.

Unfortunately, clinical studies designed to test these hypotheses have produced inconsistent results. So, we are left with the question:

3) Why are studies on artificial sweeteners so confusing? 

A recent clinical study (AG Yunker et al, JAMA Network Open, 4(9):e2126313, 2021) sheds light on all 3 of these important questions.

How Was This Study Done?

Clinical StudyThis study was called the “Brain Response to Sugar” study. It was designed to test the hypothesis that previous studies of artificial sweeteners may have provided misleading results because they didn’t account for the sex and BMI (a measure of obesity) of the study participants.

Many previous studies had primarily enrolled male, ideal weight participants. This study hypothesized that the response to artificial sweeteners might be different in female, overweight participants.

This study recruited 76 participants from the Southern California area between July 2016 and March 2020, when recruitment was halted because of the COVID-19 pandemic. The characteristics of the participants were:

  • 18-35 years old.
  • Weight stable for at least 3 months before the study.
  • Not taking medications and no history of eating disorders, diabetes, or other diseases.
  • 42% male and 58% female.
  • 37% healthy weight, 32% overweight, and 31% obese.
  • 40% included artificial sweeteners in their diet prior to the study, 60% did not.

The study was what is called a “within-participant randomized crossover trial”. Simply put, this means that each participant served as their own control. Here is how it worked:

  • Each participant came to the Dornsife Cognitive Neuroimaging Center three times. They arrived at the testing center at 8 AM after an overnight fast.
    • They drank either 75 grams of sucrose in 300 mL of water, enough sucralose in 300 mL of water to provide equivalent sweetness, or 300 mL of plain water at the beginning of each visit. The order in which the drinks were administered was randomized.
  • At 20 minutes after each drink, the participants were placed into an MRI machine shown various food and non-food images.
    • Four high-calorie food images (2 sweet and 2 savory), 4 low-calorie food images, and 4 non-food images were shown to the participants in random order.
    • As the images were shown, the MRI scanned the medial frontal cortex and orbitofrontal cortex, regions of the brain associated with appetite and hunger. Specifically, these are regions of the brain that affect:
      • Conditioned motivation to eat.
      • The reward value associated with food cues.
      • In addition, greater food cue reactivity in these regions of the brain has been shown to be associated with obesity.
  • At 125 minutes after each drink, the participants were allowed to select their meal from a buffet table, and the calories consumed was recorded.

Can Artificial Sweeteners Make You Hungry?

HungryHere are the results of the study:

  • There was no overall difference in brain activity in the regions of the brain associated with appetite, hunger, and desire for high-calorie foods following the sucralose and sucrose drinks. However:
    • For participants who were obese, high-calorie savory food images elicited greater brain activity in participants who had consumed sucralose than in participants who had consumed sucrose drinks. This difference was not seen in patients who were normal weight or overweight.
    • For female participants, high-calorie sweet and savory food images elicited greater brain activity in participants who had consumed sucralose than in participants who had consumed sucrose drinks. This difference was not seen in male patients.
    • These differences were not small. The effect of sucralose on brain activity in regions that control appetite and hunger was several-fold greater than the effect sucrose on brain activity in these regions.
    • And as you might expect, the different response to sucralose and sucrose was greatest for women who were obese.
  • Participants consumed more calories at the buffet table after the sucralose drink than after the sucrose drink.
    • There was no significant effect of weight on the differential response to sucralose and sucrose. However:
    • The differential response to sucralose and sucrose was larger for female participants than for the whole group.
  • These results are consistent with previous studies suggesting that appetite responses to food cues might be greater in females and individuals with obesity. However, this was the first study designed to directly test this hypothesis.

The authors concluded, “Our findings indicate that female individuals and those who are obese, and especially female individuals with obesity, might be particularly sensitive to greater neural responsivity elicited by sucralose compared to sucrose consumption. This study highlights the need to consider individual biologic factors in research studies and potentially dietary recommendations regarding the use and efficacy of non-nutritive sweeteners [artificial sweeteners] for body weight management.”

[Note: You may have noticed that the authors extrapolated from their data on sucralose to all artificial sweeteners. Is this extrapolation valid? The short answer is, “We don’t know”. Most of the mechanistic studies have been done with sucralose, but some studies suggest these same effects may be seen with other artificial sweeteners.]

Why Is There So Much Confusion About Artificial Sweeteners?

confusionIt seems like a “no brainer” that zero calorie drinks and reduced calorie foods would reduce weight gain and promote weight loss. But that just doesn’t seem to happen in the real world. Why is that?

  • Is it psychological? Do we feel so virtuous about consuming artificially sweetened foods and drinks that we allow ourselves to splurge on high-calorie junk foods?
  • Or is it physiological? Do artificial sweeteners increase our appetite for high-calorie junk foods?

Unfortunately, clinical studies have not been much help. Some studies suggest that artificial sweeteners increase our appetite for high-calorie foods, while others suggest they don’t. Clinical studies are supposed to resolve questions like these. Why have they been so confusing?

Part of the problem is that some of the studies on artificial sweeteners have been too small and/or too poorly designed to provide clear-cut answers. However, even well-designed clinical studies have two fundamental flaws:

  • Clinical studies are based on averages. They assume everyone is the same.
    • This study, and others like it, show the flaw in that assumption.
      • It appears that artificial sweeteners affect the appetite for high calorie foods more in individuals who are obese than in individuals who are normal weight or slightly overweight.
      • Artificial sweeteners also affect the appetite for high calorie foods more for females than for males.
      • What about age and ethnicity? Is the effect of artificial sweeteners on the appetite for high calorie foods affected by age or ethnicity? No one knows.
      • What about genetics? Is the effect of artificial sweeteners dependent on our genetic background? No one knows.
      • What about our microbiome? Again, no one knows.
  • Gold standard clinical studies only change one variable at a time. In studies of artificial sweeteners, the variable is artificial sweetener versus sugar. But we don’t eat just artificial sweeteners or sugar. We eat foods containing artificial sweeteners or sugar. Do the foods we eat alter the effect of the artificial sweeteners on appetite?
    • One recent study) suggests they might. It found that consumption of sucralose plus easily digested carbohydrate (such as might be found in artificially sweetened junk foods) may increase the craving for sweets more than consumption of either sucralose or sucrose alone.

What Does This Study Mean For You?

Simply put, the initial promise of artificial sweeteners as a solution to the obesity epidemic and the alarming increase in diabetes has not been borne out by either clinical studies or real-life experience.

And I have not addressed the potential risks of artificial sweeteners in this article. However, in my opinion, something that has potential risks, no matter how small, and no proven benefit is something to avoid.

But don’t take my word for it. As I reported in a previous “Health Tips From the Professor” article, an international consortium of scientists recently reviewed all the pertinent literature and published a position paper on whether artificially sweetened beverages were of value in responding to the global obesity crisis. They concluded:

  • “In summary, the available evidence…does not consistently demonstrate that artificially-sweetened beverages are effective for weight loss or preventing metabolic abnormalities [pre-diabetes and diabetes]. Evidence on the impact of artificially-sweetened beverages on child health is even more limited and inconclusive than in adults.”
  • “The absence of evidence to support the role of artificially sweetened beverages in preventing weight gain and the lack of studies on their long-term effects on health strengthen the position that artificially-sweetened beverages should not be promoted as part of a healthy diet.”

The Bottom Line

When artificial sweeteners were first introduced over 100 years ago, we were promised they would end obesity. We didn’t have to change our diets. We could just substitute calorie-free artificial sweeteners for sugar in all our favorite foods.

Since then, both consumption of artificial sweeteners and obesity have skyrocketed in this country. Clearly, something isn’t working. Artificial sweeteners are not the magic solution we once thought they would be.

In recent years some studies have suggested that the reason that artificial sweeteners have failed us is that they stimulate our appetite for high calorie foods. However, this idea has been controversial. Some studies have supported it. Others have not.

Why have the clinical studies been so confusing? The study I describe in this article was designed to test the hypothesis that previous studies of artificial sweeteners may have provided misleading results because they didn’t account for the sex and BMI (a measure of obesity) of the study participants.

Many previous studies had primarily enrolled male, ideal weight participants. This study hypothesized that the response to artificial sweeteners might be different in female, overweight participants. The study found:

  • There was no overall difference in brain activity in the regions of the brain associated with appetite, hunger, and desire for high-calorie foods following consumption of drinks containing sucralose or sucrose. However:
    • For participants who were obese, high-calorie savory food images elicited greater brain activity in participants who had consumed sucralose than in participants who had consumed sucrose drinks.
    • For female participants, high-calorie sweet and savory food images elicited greater brain activity in participants who had consumed sucralose than in participants who had consumed sucrose drinks.
    • These differences were not small. The effect of sucralose on brain activity in regions that control appetite and hunger was several-fold greater than the effect sucrose on brain activity in those regions.
  • Participants consumed more calories at the buffet table after the sucralose drink than after the sucrose drink.
    • The differential response to sucralose and sucrose was larger for female participants than for the whole group.
  • These results are consistent with previous studies suggesting that appetite responses to food cues might be greater in females and individuals with obesity. However, this was the first study designed to directly test this hypothesis.

The authors concluded, “Our findings indicate that female individuals and those who are obese, and especially female individuals with obesity, might be particularly sensitive to greater neural responsivity elicited by sucralose compared to sucrose consumption. This study highlights the need to consider individual biologic factors in research studies and potentially dietary recommendations regarding the use and efficacy of non-nutritive sweeteners [eg, artificial sweeteners] for body weight management.”

For more details about this study and what it means for you, read the article above.

These statements have not been evaluated by the Food and Drug Administration. This information is not intended to diagnose, treat, cure, or prevent any disease.

Is Diabetes Increasing In Our Children?

Why Is Diabetes Increasing In Our Children? 

Author: Dr. Stephen Chaney

Last week I shared a study documenting the alarming increase in ultraprocessed food consumption by our children and the effect it was having on their health (https://www.chaneyhealth.com/healthtips/are-we-killing-our-children-with-kindness/). For example, childhood obesity is closely linked to ultraprocessed food consumption.

In case you don’t understand why that is, here is what I said last week: “Because ultraprocessed foods are made in a factory, not grown on a farm:

  • They are high in fat, sugar, and refined carbohydrates. That means they have a high caloric density. Each bite has 2-3 times the calories found in a bite of fresh fruits and vegetables.
  • Even worse, the food industry has weaponized our natural cravings for sweet, salty, and fatty foods. They feed their prototypes to a series of consumer tasting panels until they find the perfect blend of sugar, salt, and fat to create maximum craving.
  • And if that weren’t enough, they add additives to create the perfect flavor and “mouth appeal”.
    • It is no wonder that clinical studies have found a strong correlation between high intake of ultraprocessed food and obesity in both children and adults.
    • It is also no wonder that the rate of childhood obesity has almost quadrupled in the last 40 years.”

Unfortunately, whenever you see an increase in obesity, type 2 diabetes is not far behind. Several studies have reported a dramatic increase in type 2 diabetes in our children over the last 20 years.

Because diabetics can manage their blood sugar levels with insulin and/or a variety of drugs, many people consider it as just an inconvenience. Nothing could be further from the truth. Diabetes is a deadly disease, and it is even deadlier when it appears early in life.

You probably already know that long-term complications of diabetes include heart disease and irreversible damage to nerves, kidneys, eyes, and feet. But you may not have known that childhood diabetes is more dangerous than diabetes in adults because:

  • It is more challenging to manage in children.
  • The complications of diabetes start to show up much earlier in life and affect quality of life at a much earlier age. For example:
    • Cardiovascular events occur 15 years earlier in someone with diabetes.
    • On average, a 50-year-old with diabetes will die 6 years earlier than someone without diabetes.
    • On average, a 10-year-old with diabetes will die 19 years earlier than a child without diabetes.

The study (JM Lawrence et al, JAMA, 326: 717-727, 2021) I will discuss today is the largest and most comprehensive study of childhood diabetes to date.

How Was This Study Done?

Clinical StudyThe data for this study were obtained from the SEARCH For Diabetes In Youth Study. This study collected data on physician-diagnosed cases of diabetes in 3.47 million children ages 19 or younger from 6 geographical areas in the US in 2001, 2009, and 2017.

The 6 geographical areas were:

  • Southern California (7 counties, including Los Angeles).
  • Colorado (14 counties, including Denver).
  • Ohio (8 counties, including Cincinnati)
  • South Carolina (4 counties, including Columbia).
  • Washington State (5 counties, including Seattle).
  • Indian Health Service users in select areas of Arizona and New Mexico.

The data on diabetes diagnoses were obtained by creating active surveillance networks composed of pediatric and adult endocrinologists, other clinicians, hospitals, and health plans in the study areas.

Is Diabetes Increasing In Our Children?

IncreaseTo answer this question let’s start with a historical perspective:

  • In 1950 obesity in US children was rare and type 2 diabetes in children was practically unknown.
    • Since then, obesity rates have skyrocketed, and type 2 diabetes has followed along behind it.
  • Between 1925 and 1950 the prevalence of type 1 diabetes in US children remained constant, but it has been steadily increasing since 1950.
    • Type 1 diabetes remains more prevalent than type 2 diabetes in our children, but the prevalence of type 2 diabetes has been increasing faster than type 1 diabetes.

Now let’s look at the results from the SEARCH For Diabetes In Youth Study:

Prevalence of Type 2 Diabetes:

  • The prevalence of type 2 diabetes in US children aged 10-19 increased from 0.34/1000 youths in 2001, to 0.46/1000 youths in 2009, to 0.67/1000 youths in 2017.
    • This is a 94% increase between 2001 and 2017. Put another way, the prevalence of type 2 diabetes in our children has almost doubled in just 16 years!
    • The greatest increase was seen among Black (0.85/1000 youths), Hispanic (0.57/1000 youths), and American Indian (0.42/1000 youths) population groups.
  • These data are consistent with 3 previous studies reporting a doubling of type 2 diabetes in children over similar time periods.

Note: Since data collection ended in 2017, this study does not take into account the increase in type 2 diabetes caused by increased body weight and reduced activity in children during the pandemic. There are no firm data on the increase in type 2 diabetes in children during the pandemic, but some hospitals have reported increases of 50% to 300% in new diagnoses of type 2 diabetes in 2020.

Prevalence of Type 1 Diabetes:

  • The prevalence of type 1 diabetes in US children aged 19 and younger increased from 1.48/1000 youths in 2001, to 1.93/1000 youths in 2009, to 2.15/1000 youths in 2017.
  • This is a 45% increase between 2001 and 2017.
    • The greatest increase was seen among White (0.93/1000 youths), Black (0.89/1000 youths), and Hispanic (0.59/1000 youths) population groups.
    • These data are consistent with a similar study of type 1 diabetes in children in Holland.

In summary:

  • This study documents a dramatic increase in the prevalence of both type 1 and type 2 diabetes in US children between 2001 and 2017.
  • Type 2 diabetes is still less prevalent than type 1 diabetes in US children, but it is increasing twice as fast.

Why Is Diabetes Increasing In Our Children?

Question MarkWhen it comes to type 2 diabetes, the experts agree:

  • The increase in type 2 diabetes in children is directly related to the obesity epidemic, which is now impacting our children. The obesity epidemic is, in turn, caused by:
    • Decreased exercise. Video games and social media have replaced actual games played outside.

However, when it comes the increase in type 1 diabetes, the experts are perplexed. There is no easy explanation. Let’s start with the basics:

  • Type 1 diabetes is an autoimmune disease. With type 1 diabetics, their immune system starts attacking the insulin-producing beta cells in their pancreas. Consequently, they lose the ability to produce insulin.
  • The autoimmune response seen in type 1 diabetes is caused by a combination of genes and environment. Specifically:
    • Certain genes predispose to type 1 diabetes. However:
      • Only some people with those genes develop type 1 diabetes.
      • Our genetics doesn’t change with time, so genetics cannot explain the increases in type 1 diabetes we are seeing.
  • That leaves the environment. There are many hypotheses about how our children’s environment influences their risk of developing type 1 diabetes. However:
    • Some of these hypotheses involve things that have not changed over the last 15-20 years. They cannot explain the increase in type1 diabetes we are seeing in children.
    • Some of these hypotheses are not supported by good data. They are speculative.

With that in mind, I will list the top 5 current hypotheses and evaluate each of them.

#1: The viral infection hypothesis: Basically, this hypothesis states that type 1 diabetes can be triggered by child with flucommon viral infections such as the flu.

  • This is a plausible hypothesis. Whenever our immune system is stimulated by invaders it sometimes goes rogue and triggers autoimmune responses.
  • It is also supported by good data. The onset of type 1 diabetes is often associated with a viral infection in genetically susceptible children.
  • However, prior to the pandemic viral infections have been constant. They haven’t changed over time. Therefore, they cannot explain an increase in type 1 diabetes between 2001 and 2017.

#2: The hygiene hypothesis: Basically, this hypothesis states that when we raise our children in a sterile environment, their immune system doesn’t develop normally. Essentially the hypothesis is saying that it’s not a bad thing if your toddler eats some dirt and moldy fruits. However:

  • The data linking hygiene to food allergies is better than the data linking hygiene to autoimmune responses.
  • There is no evidence that hygiene practices have changed significantly between 2001 and 2017.

#3: The vitamin D hypothesis: Basically, this hypothesis states that vitamin D deficiency is associated with the autoimmune response that causes type 1 diabetes.

  • One of the functions of vitamin D is to regulate the immune system.
  • As I have reported previously, suboptimal vitamin D levels are associated with increased risk of developing type 1 diabetes.
  • While we know that up to 61% of children in the US have suboptimal vitamin D levels, we don’t know whether that percentage has changed significantly in recent years.

happy gut bacteria#4: The gut bacteria hypothesis: Basically, this hypothesis suggests that certain populations of gut bacteria increase the risk of developing type 1 diabetes. This is what we know.

  • Children who develop type 1 diabetes have a unique population of gut bacteria.
  • This population of gut bacteria also triggers inflammation, and chronic inflammation can lead to autoimmune responses.
  • A diet rich in highly processed foods supports growth of the same gut bacteria found in children with type 1 diabetes.
  • Consumption of highly processed foods has increased significantly in the last twenty years.

#5: The obesity hypothesis: Basically, this hypothesis suggests that obesity increases the risk of developing type 1 diabetes.

  • While the mechanism is not clear, childhood obesity is associated with both inflammatory and autoimmune diseases like type 1 diabetes.
  • Childhood obesity has increased dramatically in the past few years.

As you may have noticed, there are weaknesses to each of these hypotheses. This is why there is no current agreement among experts as to why type 1 diabetes is increasing in our children.

My guess is that none of these hypotheses can fully explain the increase in type 1 diabetes in our children, but that several of them may contribute to it.

What Can We Do?

Family Riding BicyclesWhatever the mechanism, the increase in both type 1 and type 2 diabetes in our children is troubling. Unless this trend is reversed, we may be dooming our children to short, unhealthy lives. So, what can we, as concerned parents and grandparents, do?

For type 2 diabetes, the answer is clear.

1) Reverse the dominance of ultraprocessed foods in children’s diets. Encourage the consumption of whole, unprocessed or minimally processed foods, and include lots of fresh fruits and vegetables. Set a good example as well.

2) Encourage more activity. Get them outside and moving. Create family activities that involve exercise.

3) Reverse the obesity epidemic. If we succeed in reversing the dominance of ultraprocessed foods in their diet and encouraging more activity, we can reverse the obesity epidemic without putting our children on crazy diets.

For type 1 diabetes, the answer is less clear because the cause for the increase in type 1 diabetes is uncertain. However, I will point out that:

1) Increased consumption of fresh fruits and vegetables, whole grains, and legumes supports the growth of friendly gut bacteria that reduce inflammation and the risk of autoimmune diseases. For more detail on an anti-inflammatory diet, click here.

2) Reversing the obesity epidemic also reduces inflammation and the risk of autoimmune diseases.

3) Adequate vitamin D levels reduce the risk of autoimmune diseases, including type 1 diabetes. My recommendation is to get your 25-hydroxyvitamin D levels tested and supplement with vitamin D3 as needed, especially during the winter months.

The Bottom Line

Last week I shared a study documenting the alarming increase in ultraprocessed food consumption by our children and the effect it was having on their health. For example, childhood obesity is closely linked to ultraprocessed food consumption, and the rate of childhood obesity has almost quadrupled in the last 40 years.

Unfortunately, whenever you see an increase in obesity, type 2 diabetes is not far behind. This week’s study looked at the prevalence of childhood diabetes in 3.47 million children from 6 geographical areas of the United States between 2001 and 2017. This study found:

  • The prevalence of type 2 diabetes in US children increased 94% between 2001 and 2017. It almost doubled.
  • The prevalence of type 1 diabetes in US children increased 45% between 2001 and 2017.

These statistics are tragic because diabetes is a deadly disease.

You probably already know that long-term complications of diabetes include heart disease and irreversible damage to nerves, kidneys, eyes, and feet. But you may not have known that childhood diabetes is more dangerous than diabetes in adults because:

  • It is more challenging to manage in children.
  • The complications of diabetes start to show up much earlier in life and affect quality of life at a much earlier age. For example:
    • Cardiovascular events occur 15 years earlier in someone with diabetes.
    • On average, a 50-year-old with diabetes will die 6 years earlier than someone without diabetes.
    • On average, a 10-year-old with diabetes will die 19 years earlier than a child without diabetes.

For more details about this study, why the prevalence of diabetes in US children is increasing, and what we can do about it, read the article above.

These statements have not been evaluated by the Food and Drug Administration. This information is not intended to diagnose, treat, cure, or prevent any disease

Are We Killing Our Children With Kindness?

The Danger Of Ultraprocessed Foods 

Author: Dr. Stephen Chaney

fast foodIt breaks my heart when I see a mom and her children in the checkout line of a supermarket with a cart filled with sodas, sweets, and convenience foods and devoid of fresh fruits and vegetables – or when I see fast food restaurants packed with parents and their children.

I get it. Our kids love these foods. It seems like an act of kindness to give them the foods they crave. But are we killing our children with kindness?

Let me explain. The human brain is hardwired to crave sweets, salt, and fat. In prehistoric times each of these cravings had a survival benefit. For example:

  • Mother’s milk is naturally sweet. It only makes sense that babies should crave the nutrition source that is essential for their early growth and development.
  • Fruits provide a cornucopia of vitamins, minerals, and phytonutrients. But fruits were scarce and seasonal in prehistoric times. Their sweetness provided an incentive for early man to seek them out.
  • Some salt is essential for life. Yet in early history it was scare. It was worth its weight in gold.
  • In prehistoric times it was feast or famine. The human body has an unlimited capacity to store fat in times of plenty, and those fat stores carried early man through times of famine.

Today most Americans live in a time of food abundance. There are fast food restaurants on almost every street corner and in every shopping mall. We think of famine as the days we skipped lunch because we were busy.

Yet these cravings remain, and the food industry has weaponized them. They are churning out an endless supply highly processed foods and beverages. These foods are not being designed to improve their nutritional value. They are designed to satisfy our cravings and lure us and our children into consuming more of them every year.

Scientists have developed a classification system that assigns foods in the American diet to different groups based on the degree of processing of that food. As you might expect, the best classification is unprocessed foods. The worst classification is called “ultraprocessed foods”. [I will describe this classification system in more detail in the next section.]

It is time we asked how much ultraprocessed foods our children are eating and what it is doing to their health. That is the topic of the study (L Wang et al, JAMA, 326: 519-530, 2021) I will discuss today.

How Was This Study Done?

Clinical StudyThe data for this study were obtained from NHANES (National Health and Nutrition Examination Survey) dietary data collected from 33,795 American children (ages 2-19, average age = 10) between 1999 and 2018.

NHANES is a program conducted by the CDC to survey the health and nutritional status of adults and children in the United States. The survey has been conducted on a continuous, yearly basis since 1999.

The dietary data are collected via 24-hour dietary recalls conducted by trained interviewers, with a second recall administered over the phone 3-10 days later to improve the accuracy of the data.

  • Children aged 12-19 completed the dietary survey on their own.
  • For children aged 6-11, a parent or guardian assisted them in filling out the survey.
  • For children aged 2-5, a parent or guardian filled out the survey for them.

The foods and beverages consumed by the children were divided into 4 major groups based on the extent of processing using a well-established classification system called NOVA. The 4 groups are:

1) Unprocessed Or Minimally Processed Foods.

  • This includes whole foods and foods that are minimally processed without the addition of oils, fats, sugar, salt, or other ingredients to the food.
  • Examples of minimally processed foods include things like oatmeal, nut butters, dried fruit, frozen fruits or vegetables, and dried beans.

2) Processed Culinary Ingredients.

  • This includes recipes from restaurants or in-home cooking that add small amounts of oils, fats, sugar, salt, and seasonings to whole foods.

3) Processed Foods

  • This includes foods made in factories by the addition of salt, sugar, oil, or other substances added to whole or minimally processed foods.
  • Examples include tomato paste, canned fruits packed in sugar syrup, cheese, smoked or cured meat.

4) Ultraprocessed Foods

  • These are industrial formulations created in factories mostly or entirely from substances extracted from foods (oils, fats, sugar, starch, and proteins), derived from food constituents (hydrogenated fats and modified starch), or synthesized in laboratories (flavor enhancers, colors, and food additives).
  • Examples include sugar sweetened beverages; sweet or savory packaged snacks; chocolates and candies; burgers, hot dogs, and sausages; poultry and fish nuggets, pastries, cakes, and cake mixes.

Are We Killing Our Children With Kindness?

Obese ChildAs I said above, the important question is, “Are we killing our children with kindness when we give them the sugary drinks, sweets, convenience foods, and fast foods they crave?” After all, the foods we give them when they are young are the ones they are most likely to select when they get older.

Let’s start by looking at how pervasive these foods have become. That was the purpose of the study I am discussing today, and the results of this study are alarming. When they looked at the changes in food consumption by our children between 1999 and 2018:

  • The percentage of calories from ultraprocessed foods increased from 61.4% to 67%. That means:
    • Today, more than 2/3 of the calories our children consume daily come from ultraprocessed foods!
  • The percentage of calories from unprocessed and minimally processed foods decreased from 28.8% to 23.5%. That means:
    • In the span of just 19 years the diets of our children have gone from bad to worse!
  • Ultraprocessed foods were more likely to be consumed away from home and at fast food restaurants.

When the investigators looked at individual categories of ultraprocessed foods:

  • The percentage of calories coming from ready to heat and eat dishes like frozen pizzas and other frozen meals or snacks increased from 2.2% to 11.2%.
  • The percentage of calories coming from sweet snacks and desserts increased from 10.7% to 12.9%.
  • The percentage of calories coming from sugar sweetened beverages decreased from 10.8% to 5.3%.
    • This is potentially the only good news from this study.

The authors concluded. “Based on NHANES data from 1999 to 2018, the estimated energy intake from consumption of ultraprocessed foods has increased among youths in the US and has consistently comprised the majority of their total energy intake.”

“These results suggest that food processing may need to be considered as a food dimension in addition to nutrients and food groups in future dietary recommendations and food policies.”

The Danger Of Ultraprocessed Foods

Fast Food DangersThis study clearly shows that ultraprocessed foods have become the mainstay of our children’s diets. Forget a balanced diet! Forget “Eat your fruits and vegetables”! Our children’s diets have been fundamentally transformed by “Big Food, Inc”.

You might be saying to yourself, “So, they are eating their favorite processed foods. What’s the big deal? How bad can it be?” My answer is, “Pretty Bad”. I chose the title, “Are we killing our children with kindness”, for a reason.

When you look at what happens to children who eat a diet that is mostly ultraprocessed foods:

#1: Their nutrition suffers. When the investigators divided the children into 5 groups based on the percentage of calories coming from ultraprocessed foods, the children consuming the most ultraprocessed food had:

  • Significantly higher intakes of carbohydrates (mostly refined carbohydrates); total fats; polyunsaturated fats (mostly highly processed omega-6-rich vegetable oils); and added sugars.
  • Significantly lower intakes of fiber; protein; omega-3 polyunsaturated fatty acids; calcium; magnesium; potassium; zinc; vitamins A, C, D, and folate.
    • The low intake of fiber means our children will be less likely to have health-promoting friendly bacteria and more likely to have disease-promoting bad bacteria in their guts.
    • The low intake of calcium, magnesium, and vitamin D means they will be less likely to achieve maximum bone density as young adults and will be more likely to suffer from osteoporosis as they age.

#2: They are more likely to become obese. Remember, these are foods that are made in a factory, not grown on a farm.

  • They are high in fat, sugar, and refined carbohydrates. That means they have a high caloric density. Each bite has 2-3 times the calories found in a bite of fresh fruits and vegetables.
  • As I said earlier, the food industry has weaponized our natural cravings for sweet, salty, and fatty foods. They feed their prototypes to a series of consumer tasting panels until they find the perfect blend of sugar, salt, and fat to create maximum craving.
  • And if that weren’t enough, they add additives to create the perfect flavor and “mouth appeal”.
    • It is no wonder that clinical studies have found a strong correlation between high intake of ultraprocessed food and obesity in both children and adults.
    • It is also no wonder that the rate of childhood obesity has almost quadrupled (5% to 18.5%) in the last 40 years.

#3: They are more likely to become sick as adults and die prematurely.

  • Obesity; high intake of fat, sugar, and refined carbohydrates; and low intake of fiber, omega-3s, and essential nutrients all contribute to an increased risk of diabetes, heart disease, and some cancers.
    • It is no wonder that clinical studies have found a strong correlation between high intake of ultraprocessed food and increased risk of diabetes, heart disease, some cancers, and premature death in adults.
    • It is also no wonder a recent study found that type 2 diabetes in children has almost doubled between 2001 and 2017.

The data are clear. When we allow our children to subsist on a diet mostly made up of the ultraprocessed foods they crave, we may be giving them, not love, but a lifetime of obesity and declining health instead. And yes, we may be killing them with kindness.

Instead, my recommendations are:

  • expose your children to a variety of fresh fruits, vegetables, and minimally processed foods at an early age.
  • They will reject some of them, and that’s OK. Introduce others until you find whole, minimally processed foods they like. Reintroduce them to some of the foods they initially rejected as they get older.
  • Don’t keep tempting ultraprocessed foods in your house.
  • You may just succeed in putting your children on the path to a healthier diet and a healthier, longer life.

The Bottom Line

It breaks my heart when I see a mom and her children in the checkout line of a supermarket with a cart filled with sodas, sweets, and convenience foods and devoid of fresh fruits and vegetables – or when I see fast food restaurants packed with parents and their children.

I get it. Our kids love these foods. It seems like an act of kindness to give them the foods they crave. But are we killing our children with kindness?

It is time we asked how much ultraprocessed foods our children are eating and what it is doing to their health. A recent study did just that. When they looked at the changes in food consumption by our children between 1999 and 2018:

  • The percentage of calories from ultraprocessed foods increased from 61.4% to 67%. That means:
    • Today, more than 2/3 of the calories our children consume daily come from ultraprocessed foods!
  • The percentage of calories from unprocessed and minimally processed foods decreased from 28.8% to 23.5%. That means:
    • In the span of just 19 years the diets of our children have gone from bad to worse!

This study clearly shows that ultraprocessed foods have become the mainstay of our children’s diets. Forget a balanced diet! Forget “Eat your fruits and vegetables”! Our children’s diets have been fundamentally transformed by “Big Food, Inc”.

You might be saying to yourself, “So, they are eating their favorite processed foods. What’s the big deal? How bad can it be?” My answer is, “Pretty Bad”. I chose the title, “Are we killing our children with kindness”, for a reason.

When you look at what happens to children who eat a diet that is mostly ultraprocessed foods:

  • Their nutrition suffers.
  • They are more likely to become obese.
  • They are more likely to become sick as adults and die prematurely.

For more details about this study, read the article above.

These statements have not been evaluated by the Food and Drug Administration. This information is not intended to diagnose, treat, cure, or prevent any disease.

Best Way To Reduce Risk Of Breast Cancer

What Does The American Cancer Society Say About Reducing Breast Cancer Risk? 

Author: Dr. Stephen Chaney

breast cancerBreast cancer is a scary disease. The American Cancer Society tells us:

  • 281,000 women will be diagnosed with invasive breast cancer in 2021.
  • 43,000 women will die from breast cancer in 2021.
  • The good news is that both prevention and treatment of breast cancer have gotten much better:
    • The 5-year survival rate is 90%.
    • The 10-year survival rate is 84%.
    • For women over 50 the death rate has decreased by 1%/year between 2013 and 2018 (mainly due to recognition that hormone replacement therapy is a risk factor for breast cancer).
  • The bad news is:
    • The cost of breast cancer treatment can range from $50,000 to over $180,000.
    • The side effects of breast cancer treatment can be brutal.
      • For example, there is an effective treatment to prevent breast cancer recurrence for some forms of breast cancer, but many women discontinue the treatment after a few years because of the side effects.

So, wouldn’t it be wonderful if there were some simple changes you could make that would dramatically reduce your risk of developing breast cancer in the first place? There are lots of options for reducing your risk of developing breast cancer, but which one(s) should you choose?

  • Dr. Strangelove and his friends are only too happy to recommend their favorite potion, food, or diet.
  • There are long lists of foods you should avoid if you want to reduce your risk of breast cancer.
  • There are also lists of harmful chemicals in cleaners and other household products that you should avoid.

It can become confusing. It can become overwhelming. It would be easy to just throw up your hands and say, “I give up. I don’t know what to do.”

You may be thinking, “Why doesn’t someone simplify things by identifying the top few lifestyle changes that are most effective for reducing my risk of developing breast cancer?”

It turns out someone has. Today I will share two recent studies that have identified the top 6 strategies for reducing your risk of breast cancer, and I have ranked them from 1 to 6 in order of effectiveness.

What Is The Best Way To Reduce Risk Of Breast Cancer?

AwardThe first study (RM Tamimi et al, American Journal of Epidemiology, 184: 884-893, 2016 was designed to identify the major modifiable risk factors for invasive, postmenopausal breast cancer (The term “modifiable risk factors” refers to those risk factors that are under your control.

The study utilized data collected from the Nurses’ Health Study between 1980 and 2010. During that time 8,421 cases of invasive breast cancer were diagnosed in 121,700 postmenopausal women in the study. The study looked at the effect of nonmodifiable and modifiable risk factors on the development of invasive breast cancer in these women.

  • Nonmodifiable risk factors included current age, age at which menstruation began, height, age of first birth, number of births, weight at age 18, family history of breast cancer, and prior benign breast disease.
  • Modifiable risk factors included weight change since age 18, alcohol consumption, physical activity level, breastfeeding, and postmenopausal hormone therapy use.

Here were the results from the study:

  • All the risk factors included in this study accounted for 70% of the risk of developing invasive breast cancer in postmenopausal women.
  • Modifiable risk factors accounted for 34.6% of the risk of developing invasive breast cancer in postmenopausal women.

When they analyzed the effect of modifiable risk factors on the risk of developing invasive breast cancer separately:

  • 44 pounds of weight gain since age 18 increased the risk by 50%.
  • Postmenopausal hormone replacement use increased the risk by 35%.
  • More than one alcoholic beverage/day increased the risk by 32%.
  • Low physical activity increased the risk by 7%.
  • Lack of breastfeeding increased the risk by 5%.

What About The Effect Of Diet On Breast Cancer Risk?

You may be wondering, “What about the effect of a healthy diet on my risk developing invasive breast cancer?” Unfortunately, the study I described above completely disregarded the effect of diet on breast cancer risk.

However, the second study (MS Farvid et al, International Journal of Cancer, 144: 1496-1510, 2019) I will discuss today partially addresses this issue. It uses the same database as the first study and looks at the effect of fruit and vegetable consumption on the risk of developing invasive breast cancer.

When this study compared high versus low intake of fresh fruits and vegetable on the risk of developing invasive breast cancer:

  • Women eating >5.5 servings/day of fruits and vegetables had a 11% lower risk than women consuming ≤2.5 servings/day.
  • Women consuming >2.5 servings/day of fruit had a 9% lower risk than women consuming ≤0.5 servings/day.
  • Women consuming >4.5 servings/day of vegetables had a 9% lower risk than women consuming ≤0.5 servings/day.

While all fresh fruits and vegetables contributed to this effect:

  • The most protective fruits were berries and cantaloupe & melons.
  • The most protective vegetables were yams & sweet potatoes, green leafy vegetables (such as kale, mustard greens, and chard), and cruciferous vegetables (such as Brussels sprouts).

The authors concluded, “Our findings support that higher intake of fruits and vegetables, and specifically cruciferous and yellow/orange vegetables, may reduce the risk of breast cancer, especially those that are more likely to be aggressive tumors.”

Now we are ready to answer your question, “Which lifestyle changes are most effective for reducing your risk of developing breast cancer?” If we combine the two studies and rank order the modifiable risk factors, it would look like this.

#1: Minimize weight gain during your adult years.

#2: Don’t use postmenopausal hormone replacement therapy unless absolutely necessary.

#3: Drink little or no alcohol.

#4: Eat a healthy diet with lots of fresh fruits and vegetables.

#5: Be physically active.

#6: Breastfeed when possible.

What Does The American Cancer Society Say About Reducing The Risk Of Breast Cancer?

American Cancer SocietyThe advice of the American Cancer Society is remarkably similar. Here are their recommendations:

  1. Get to and stay at a healthy weight.

After menopause, most of your estrogen comes from fat tissue. Having more fat tissue increases the amount of estrogen your body makes, raising your risk of breast cancer. Also, women who are overweight tend to have higher levels of insulin. Higher insulin levels have also been linked to breast cancer.

If you are already at a healthy weight, stay there. If you are carrying extra pounds, try to lose some. Losing even a small amount of weight can also have other health benefits and is a good place to start.

3) Be physically active and avoid time spent sitting.

Current recommendations are to get at least 150-300 minutes of moderate intensity or 75-150 minutes of vigorous intensity activity each week. Getting to or exceeding 300 minutes is ideal.

In addition, you should limit sedentary behavior such as sitting, lying down, watching TV, and other forms of screen-based entertainment. This is especially important if you spend most of your working day sitting.

3) Follow a healthy eating plan.

A healthy eating pattern includes a variety of vegetables, fiber-rich legumes (beans and peas), fruits in a variety of colors, and whole grains. It is best to avoid or limit red and processed meats, sugar-sweetened beverages, highly processed foods, and refined grain products. This will provide you with key nutrients in amounts that help you get to and stay at a healthy weight.

4) It is best not to drink alcohol.

Research has shown that drinking any alcohol increases the risk of breast cancer. If you choose to drink alcohol, the American Cancer Society recommends that women have no more than 1 alcoholic drink on any given day. A drink is 12 ounces of regular beer, 5 ounces of wine, or 1.5 ounces of hard liquor.

5) Think carefully about using hormone replacement therapy.

Studies show that HRT using a combination of estrogen and progestin increases the risk of breast cancer. This combination can also lead to increased breast density making it harder to find breast cancer on mammogram.

Talk with your doctor about all the options to control your menopause symptoms, including the risks and benefits of each. If you decide to try HRT, it is best to use it at the lowest dose that works for you and for as short a time as possible.

The Bottom Line

Breast cancer is a scary disease. The good news is that detection and treatment of breast cancer has improved over the past decade. The bad news is that treatment is expensive, and the side effects can be brutal.

There are lots of options for reducing your risk of developing breast cancer, but which one(s) should you choose?

  • Strangelove and his friends are only too happy to recommend their favorite potion, food, or diet.
  • There are long lists of foods you should avoid if you want to reduce your risk of breast cancer.
  • There are also lists of harmful chemicals in cleaners and other household products that you should avoid.

It can become confusing. It can become overwhelming. It would be easy to just throw up your hands and say, “I give up. I don’t know what to do.”

You may be thinking, “Why doesn’t someone simplify things by identifying the top few lifestyle changes that are most effective for reducing my risk of developing breast cancer?”

It turns out someone has. Today I will share two recent studies that have identified the top 6 strategies for reducing your risk of breast cancer, and I have ranked them from 1 to 6 in order of effectiveness in the article above.

For more details about these studies, my ranking of the top 6 strategies for reducing your risk of breast cancer, and the American Cancer Society recommendations, read the article above.

These statements have not been evaluated by the Food and Drug Administration. This information is not intended to diagnose, treat, cure, or prevent any disease.

Health Tips From The Professor