Are Our Healthy Years Getting Shorter?

What Does This Mean For You?

Author: Dr. Stephen Chaney

If you’ve ever traveled the subway system in London, you can’t have missed the “Mind the Gap” signs warning not to put your foot in the gap between the subway and the platform.

That warning is more important than ever in an age where people look at their cell phones rather than where they are walking. Of course, if they are looking at their cell phones, they might miss the sign and…

But today’s “Health Tip” is not about subway gaps. It’s about a far more important gap – the gap between our healthspan (how many years we enjoy good health) and our lifespan (how many years we live).

A recent study (L Gimeno et al, The Journals of Gerontology, Series B, 79(8), gbae113, 2024) suggesting that our healthy years are getting shorter caught my attention.

All of us imagine that our golden years will be ones of vibrant health. We’ll travel to exotic places. We’ll take long walks in the mountains. We’ll play with our grandchildren. Life will be wonderful.

But if this study is correct, none of that will happen for many young Americans. They will be too frail and sick to enjoy their golden years. They will be surviving rather than thriving.

So, in today’s “Health Tips From the Professor” I will review the study and tell you what it means for you.

How Was The Study Done?

clinical studyThe investigators used data on 114,526 adults >50 (average age = 63) from developed countries (the United States, England, and continental Europe). Specifically, they used data from people who participated in the Healthy and Retirement Study (26,939 people in the United States), the English Longitudinal Study on Ageing (14,992 people in England), and the Survey of Health, Ageing, and Retirement (72,595 people in continental Europe) between 2004 and 2018.

These surveys collected data on health-related outcomes every 2 years. The outcomes measured were:

  • Six activities of daily living (ADLs) such as eating, bathing, and walking.
  • Four instrumental activities of daily living (IADLs) related to essential tasks such as grocery shopping or preparing a hot meal.
  • Seven measures of mobility difficulties and motor coordination tasks such as walking one block, lifting 10 pounds, or picking up a small coin from a flat surface.

The assumption was that the severity of limitations was ADL > IADL > mobility difficulties. This is based on previous research showing that a person with ADL limitations is likely to have IADL limitations and mobility difficulties. And a person with IADL limitations is likely to have mobility difficulties. Based on this assumption, they classified participants in this study into 4 disability categories:

  • Mild disability: ≥1 IADL limitations and any number of mobility difficulties.
  • Moderate disability: 1-2 ADL limitations with any number of IADL limitations and mobility difficulties.
  • Severe disability: ≥3 ADL limitations with any number of IADL limitations and mobility difficulties.

The study also measured the prevalence (percent of the population) with:

  • Obesity
  • Heart disease.
  • Diabetes
  • Cancer
  • Lung disease.
  • High blood pressure.
  • High cholesterol.

Finally, the study also measured grip strength because loss of grip strength is considered an indicator of future disabilities.

The unique feature of this study is it compared the health and disability of people who were at the same age when tested but were born in different decades ranging from 1925 to 1955.

Because of the rapid change in diet and lifestyle following World War II, the health and disability of people born in the 1936-1945 decade encompassing World War II was used as the standard to which all other decades were compared.

Are Our Healthy Years Getting Shorter?

Some of you may have skipped over the previous section, so I will repeat the way these data were analyzed because it is crucial to your understanding of the study.

“The unique feature of this study is it compared the health and disability of people who were at the same age when tested but were born in different decades ranging from 1925 to 1955.

Because of the rapid change in diet and lifestyle following World War II, the health and disability of people born in the 1936-1945 decade encompassing World War II was used as the standard to which all other decades were compared.”

When looking at data from the United States, there were two distinct patterns.
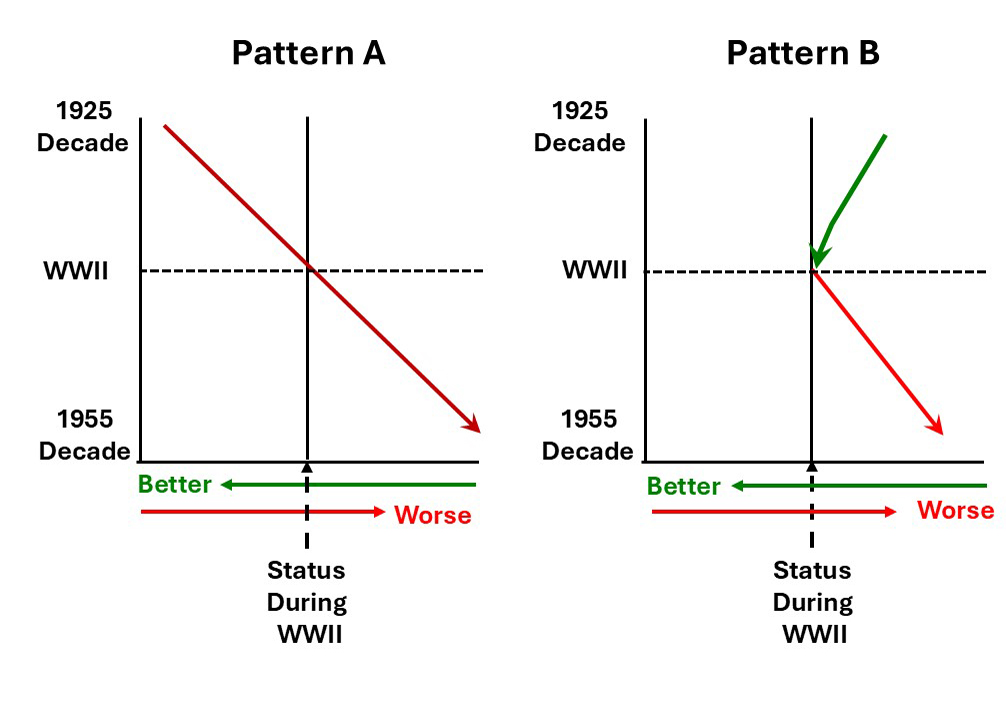
The vertical line in the center of the graph represents the health and disability status of people born during World War II because all comparisons in this study were to people born in the decade encompassing World War II. A worsening of health and disabilities is indicated in red and an improvement in health and disabilities is shown in green. 

Pattern A was characteristic of a constant worsening of health and disabilities from people born in the decade starting in 1925 to people born in the decade starting in 1955.

This pattern was seen for:

  • Obesity
  • Heart disease.
  • Diabetes
  • Lung disease.
  • High blood pressure.
  • High cholesterol.
  • Severe disabilities.
  • Reduction in grip strength.

Remember, this study is measuring health and disability of people at the same age. The only difference is when they were born. It tells us people in their 50s, 60s, or 70s born in 1955 or later are in poorer health than people of the same age who were born in 1925.

And it’s not just the United States. For obesity and health parameters the pattern was the same for England and Europe. For severe disabilities the pattern was the same for England but was not as clear for Europe.

Two things should be noted for this pattern:

  • The worsening of health and the increase in severe disabilities comes despite the vast improvements in the health care systems in these countries and improved understanding of the causes of these diseases.
  • Obesity is likely a major driver of our declining health and increased disability. However, it is not the only driver. If the investigators had graphed the percentage of highly processed foods in the diet or the decline in regular exercise, the pattern would have been similar.

Pattern B shows an improvement in the period leading up to World War II and a deterioration in the period after World War II. The authors interpreted the improvement prior to World War II as due to improvements in health care and the deterioration after World War II as due to changes in diet and lifestyle.

This is the pattern seen for mild and moderate disabilities in the United States. The pattern for mild and moderate disabilities was not as clear for England and Europe.

The authors concluded, “In all regions, we found evidence for worsening health across cohorts [groups of people born in successive decades], particularly for those born after 1945.”

What Does This Study Mean For You?

QuestionsI don’t want to overinterpret this study. This study breaks new ground, but it has some limitations that I would characterize with three statements:

  • It is a very difficult study to do perfectly.
  • There are several factors that could affect the interpretation of the data and the outcome of the study.
  • The authors made a valiant effort to correct for any factors that could have affected the outcome.

For more details about the factors that might affect the outcome of the study and how the authors corrected for them, read the study.

However, this is the first study to use this approach to gauge the decrease in healthy years (healthspan) in developed countries over the past 40 years. It has its flaws, but it is consistent with several other studies documenting declining health in the current generation of young adults. For example, in a recent issue of “Health Tips From the Professor” I reviewed a study showing that colon cancer rates are increasing at an alarming rate for young adults in this country.

At the beginning of this article, I talked about the gap between our healthspan (how many years we enjoy good health) and our lifespan (how many years we live).

This study suggests that the onset of significant health issues and disabilities is occurring at a younger age today than for people born before World War II. In short, it suggests that our healthspan (the number of healthy years) is getting shorter.

This study did not look at lifespan, but numerous studies show that our lifespan is still increasing. So, the gap between healthspan and lifespan appears to be getting larger. In simple terms this means that when today’s young adults reach their “golden years”, they may spend more of those years in poor health than those of us born in the 1940’s.

But, what does this mean for you? The take home lesson should be, “This doesn’t have to be. You don’t have to be frail and sickly in your golden years. We know how to prevent this.”

  • It starts with a healthy diet – a whole food, primarily plant-based diet with lots of colorful fruits and vegetables, whole grains, nuts and seeds.
  • Add in a regular exercise program with a mixture of aerobic and resistance exercises.
  • Include an individualized supplement program.

You notice I didn’t list weight control as one of the top three prevention strategies. That’s because I don’t recommend fad diets and rapid weight loss programs. If you do the first three things well, your weight will come off naturally – a little bit at a time.

And once you have mastered all four things, you will increase your healthy years and narrow the gap between your healthspan and your lifespan. You can look forward to golden years filled with vitality and adventure.

The Bottom Line

A recent study used an innovative approach to quantify the deterioration in health and the physical ability to function well in daily activities as we age. The unique feature of this study is it compared the health and disability of people who were at the same age when tested but were born in different decades ranging from 1925 to 1955.

The study found a constant worsening of health and disabilities from people born in the decade starting in 1925 to people born in the decade starting in 1955 for:

  • Obesity
  • Heart disease.
  • Diabetes
  • Lung disease.
  • High blood pressure.
  • High cholesterol.
  • Severe disabilities.

The authors concluded, “We found evidence for worsening health across cohorts [groups of people born in successive decades], particularly for those born since 1945.”

In short, people born in recent years have fewer healthy years (a shorter healthspan) than people born before World War II. And since our lifespans are getting longer, this means the gap between our healthspan and our lifespan is increasing.

All of us imagine that our golden years will be ones of vibrant health. We’ll travel to exotic places. We’ll take long walks in the mountains. We’ll play with our grandchildren. Life will be wonderful.

But if this study is correct, none of that will happen for many of today’s young adults. They will be too frail and sick to enjoy their golden years.

For more details about this study and how you can increase your healthy years, narrow the gap between your healthspan and your lifespan, and look forward to golden years filled with vitality and adventure, read the article above.

These statements have not been evaluated by the Food and Drug Administration. This information is not intended to diagnose, treat, cure, or prevent any disease.

 ______________________________________________________________________________

My posts and “Health Tips From the Professor” articles carefully avoid claims about any brand of supplement or manufacturer of supplements. However, I am often asked by representatives of supplement companies if they can share them with their customers.

My answer is, “Yes, as long as you share only the article without any additions or alterations. In particular, you should avoid adding any mention of your company or your company’s products. If you were to do that, you could be making what the FTC and FDA consider a “misleading health claim” that could result in legal action against you and the company you represent.

For more detail about FTC regulations for health claims, see this link.

https://www.ftc.gov/business-guidance/resources/health-products-compliance-guidance

_______________________________________________________________________

About The Author 

Dr. Chaney has a BS in Chemistry from Duke University and a PhD in Biochemistry from UCLA. He is Professor Emeritus from the University of North Carolina where he taught biochemistry and nutrition to medical and dental students for 40 years.  Dr. Chaney won numerous teaching awards at UNC, including the Academy of Educators “Excellence in Teaching Lifetime Achievement Award”. Dr Chaney also ran an active cancer research program at UNC and published over 100 scientific articles and reviews in peer-reviewed scientific journals. In addition, he authored two chapters on nutrition in one of the leading biochemistry text books for medical students.

Since retiring from the University of North Carolina, he has been writing a weekly health blog called “Health Tips From the Professor”. He has also written two best-selling books, “Slaying the Food Myths” and “Slaying the Supplement Myths”. And most recently he has created an online lifestyle change course, “Create Your Personal Health Zone”. For more information visit https://chaneyhealth.com.

For the past 45 years Dr. Chaney and his wife Suzanne have been helping people improve their health holistically through a combination of good diet, exercise, weight control and appropriate supplementation.

Can Personalized Diets Help Control Blood Sugar?

What Does This Study Mean For You? 

Author: Dr. Stephen Chaney 

Personalized diets are highly advertised. We are told to forget the old “one size fits all” diets of the past. We are told we are all different, so diets should be individualized to us.

We are promised that by collecting DNA samples from our tissue or bacteria in our gut, blood samples, and personal medical history, a personalized diet can be created that “fits us like a glove”.

But are those promises true, or are they hype? Diets to control blood sugar spikes should be a perfect topic for testing those claims. Millions of Americans have trouble controlling their blood sugar levels. Specifically:

  • 1 million adults (14.7% of US adults) have diabetes, mostly type 2 diabetes.
  • 6 million adults (38.0% of US adults) have prediabetes.
    • That amounts to 52% of the US population who have trouble controlling blood sugar levels.
  • Previous studies have shown that prediabetes and type 2 diabetes are largely reversible with diet and lifestyle change.
  • Recent studies have shown tremendous inter-person variability in the blood sugar response to any given food.
  • Previous studies have shown that our gut bacteria influence our blood sugar response to foods.

In theory, blood sugar control should be the perfect candidate for personalized diets. With that in mind, the authors of this study have created an algorithm called PNP (Personal Nutrition Program) that combines continuous blood glucose monitoring, HbA1c measurement (a measure of blood sugar control), personal characteristics (physical activities, sleep times, stress, and hunger), and a DNA analysis of stool samples to identify the species of gut bacteria. They also created a PNP app to allow participants to monitor and modify the foods they ate on a continuous basis.

In this study (AY Kharmats et al, The American Journal of Clinical Nutrition, 118: 443-451, 2023) the authors compared the effectiveness of their Personalized Nutrition Program algorithm with a standard, one-size-fits-all, low fat diet for improving blood sugar control in patients with prediabetes and type 2 diabetes.

Note: They used a low fat diet because, despite what you may have heard, low fat diets are better than low carb diets for diabetics. Of course, the low fat diet they used was created by dietitians. The carbohydrates came from whole foods rather than added sugars.

How Was The Study Done? 

Clinical StudyThe investigators recruited 156 participants from the NYU Langone Health Center between January 2018 and March 2021. The participants selected were overweight with prediabetes or moderately controlled type 2 diabetes. For participants with type 2 diabetes, it was managed with lifestyle alone or lifestyle plus metformin. Other characteristic of the study participants were:

  • Gender: 33.5% male, 66.5% female.
  • Race & Ethnicity: 55.7% white, 24.1% black, 16.5% Hispanic.
  • Education: 69.5% with a college degree.
  • Baseline BMI: 33 (Obese).
  • Baseline HbA1c: 5.8% (prediabetic range) with 12% of participants ≥6.5% (diabetic range).

The participants were randomly divided into two groups that were matched with respect to weight and blood sugar control. One group was put on a diet based on the investigator’s PNP algorithm. The other group was put on a standardized low fat (< 25% of calories from fat) diet that is often used with diabetic patients.

Upon admission to the study, blood samples were drawn for HbA1c, a detailed questionnaire was filled out, and stool samples were obtained for DNA analysis to identify the species of bacteria in their gut.

Each participant was given a continuous glucose monitoring device to wear during the study. This allowed the investigators to monitor the participants blood sugar control throughout the study.

All this information was used to provide individual diet recommendations for the personalized diet group using the PNP algorithm developed by the investigators.

The study lasted 6 months and measured improvements in blood sugar control as assessed by a decrease in blood sugar spikes and a reduction in HbA1c.

Both Groups were put on a registered dietitian-led behavioral intervention program targeting 7% weight loss and a calorie deficit goal of 500 calories per day. The 1-hour sessions were conducted by Webex weekly for 4 weeks and then every other week for the remaining 5 months. The sessions included:

  • Education (e.g., obesity risks, benefits of weight loss, strategies for restricting calories, protocols for aerobic exercise and strength training, and dealing with weight loss plateaus)
  • Behavioral change (e.g., importance of behavioral change, goal setting, self-reward, and problem-solving around common barriers to weight loss success)

The participants were advised to gradually build up to 150 min/week of moderate intensity exercise.

Each participant was given access to the PNP mobile app designed by the investigators. The app provided real-time feedback regarding their dietary intake relative to the target specific to their group (low fat diet or personalized diet). Participants were asked to use the app to:

  • Enter their dietary intake and self-monitor their meals (If the meal did not match the target specific to their group, the participants were trained how to substitute other foods, so their meal better matched their target.)
  • For the Standardized Low Fat Group, the PNP app provided real-time feedback regarding calorie intake and macronutrient distribution for meals and snacks logged in by the participants.
  • For the Personalized Group the PNP app scored meals as excellent, very good, good, bad, or very bad based on the PNP algorithm developed by the investigators.

Can Personalized Diets Help Control Blood Sugar? 

The results were clear-cut:

  • Weight loss was identical on both diets. This is no surprise. The study design included an exceptionally well-designed weight loss protocol for both groups.
  • The decrease in HbA1c was identical on both diets.
  • The improvement in blood sugar control was identical on both diets.

The investigators concluded, “[The] personalized diet did not result in an increased reduction in GV [blood sugar control] or HbA1c in patients with prediabetes or moderately controlled type 2 diabetes compared to a standardized diet.”

Since the investigators had designed the algorithm used to create personalized diets for this study, this was probably not the result they wanted.

So, they added, “Additional subgroup analyses may help to identify patients who are more likely to benefit from this personalized intervention.”

What Does This Study Mean For You? 

QuestionsThis first takeaway from this study was obvious:

  • The personally designed diet did not perform any better than a standard, one size fits all, diet at improving blood sugar control.

Of course, this was not any standard diet. It was a diet that has been used successfully with diabetics for years. However, a lot of research had gone into developing the personalized diet. One might have expected it to perform better.

This is not the first study in which a personalized diet has performed no better than a standard diet. It doesn’t mean that the concept behind personalized diets is faulty. It just means we don’t yet know enough to design a personalized diet that really works.

The second takeaway from this study might be less obvious:

  • Weight loss is the most important factor for improving blood sugar control. Any diet that reduces weight will improve blood sugar control. This is also true for many other health issues such as high cholesterol, high blood pressure, high triglycerides, and osteoarthritis.
  • However, this should not come as a surprise either.
    • Vegan and keto diets are polar opposites. Yet both give similar short-term weight loss and provide similar short-term health benefits.
    • Studies have shown that intermittent fasting gives no better weight loss and health benefits than any diet that cuts calories to a similar extent.
    • In other words, the diet you choose or the way you choose to restrict calories doesn’t matter. It is weight loss that provides the health benefits.
  • However, diet does appear to matter in the long term. If you look at studies ranging from 10 to 30 years, primarily plant-based diets provide better health benefits than primarily meat-based diets. And diets consisting primarily of whole, unprocessed foods provide better health benefits than diets high in processed foods.

Finally, there is an important corollary to this study showing that a personalized diet performed no better than a standardized diet at controlling blood sugar.

  • Some companies are trying to sell you expensive personalized diets with extravagant claims about the health benefits of their diet. Be wary of those diets. The science supporting their diets is premature. Their claims may be misleading.
  • And if the companies claim their diet is supported by published clinical studies, you should evaluate those studies carefully. The study I reviewed in this article was an exceptionally well-designed study. Any study that does not control for weight loss is likely to provide misleading results.

The Bottom Line 

A recent study compared the effectiveness of a personalized diet and a standardized diet in improving blood sugar control for patients with prediabetes or type 2 diabetes. The results were clear-cut:

  • Weight loss was identical on both diets. This is no surprise. The study design included an exceptionally well-designed weight loss protocol for both groups.
  • The decrease in HbA1c was identical on both diets.
  • The improvement in blood sugar control was identical on both diets.

This doesn’t mean that the concept behind personalized diets is faulty. It just means we don’t yet know enough to design a personalized diet that really works.

For more information on this study and what it means for you, read the article above.

These statements have not been evaluated by the Food and Drug Administration. This information is not intended to diagnose, treat, cure or prevent any disease.

______________________________________________________________________________

My posts and “Health Tips From the Professor” articles carefully avoid claims about any brand of supplement or manufacturer of supplements. However, I am often asked by representatives of supplement companies if they can share them with their customers.

My answer is, “Yes, as long as you share only the article without any additions or alterations. In particular, you should avoid adding any mention of your company or your company’s products. If you were to do that, you could be making what the FTC and FDA consider a “misleading health claim” that could result in legal action against you and the company you represent.

For more detail about FTC regulations for health claims, see this link.

https://www.ftc.gov/business-guidance/resources/health-products-compliance-guidance

_____________________________________________________________________

About The Author 

Dr. Chaney has a BS in Chemistry from Duke University and a PhD in Biochemistry from UCLA. He is Professor Emeritus from the University of North Carolina where he taught biochemistry and nutrition to medical and dental students for 40 years.  Dr. Chaney won numerous teaching awards at UNC, including the Academy of Educators “Excellence in Teaching Lifetime Achievement Award”.

Dr Chaney also ran an active cancer research program at UNC and published over 100 scientific articles and reviews in peer-reviewed scientific journals. In addition, he authored two chapters on nutrition in one of the leading biochemistry text books for medical students.

Since retiring from the University of North Carolina, he has been writing a weekly health blog called “Health Tips From the Professor”. He has also written two best-selling books, “Slaying the Food Myths” and “Slaying the Supplement Myths”. And most recently he has created an online lifestyle change course, “Create Your Personal Health Zone”. For more information visit https://chaneyhealth.com.


For the past 45 years Dr. Chaney and his wife Suzanne have been helping people improve their health holistically through a combination of good diet, exercise, weight control and appropriate supplementation.

What Is The Truth About Low Carb Diets?

Why Is The Cochrane Collaboration The Gold Standard?

Author: Dr. Stephen Chaney 

low carb dietAtkins, South Beach, Whole30, Low Carb, high Fat, Low Carb Paleo, and Keto. Low carb diets come in many forms. But they have these general characteristics:

  • They restrict carbohydrate intake to <40% of calories.
  • They restrict grains, cereals, legumes, and other carbohydrate foods such as dairy, fruits, and some vegetables.
  • They replace these foods with foods higher in fat and protein such as meats, eggs, cheese, butter, cream, and oils.
  • When recommended for weight loss, they generally restrict calories.

What about the science? Dr. Strangelove and his friends tell you that low carb diets are better for weight loss, blood sugar control, and are more heart healthy than other diets. But these claims are controversial.

Why is that? I have discussed this in previous issues of “Health Tips From The Professor”. Here is the short version.

  • Most studies on the benefits of low carb diets compare them with the typical American diet.
    • The typical American diet is high in fat, sugar and refined flour, and highly processed foods. Anything is better than the typical American diet.
  • Most low carb diets are whole food diets.
    • Any time you replace sodas and highly processed foods with whole foods you will lose weight and improve your health.
  • Most low carb diets are highly structured. There are rules for which foods to avoid, which foods to eat, and often additional rules to follow.
    • Any highly structured diet causes you to focus on what you eat. When you do that, you lose weight. When you lose weight, your health parameters improve.
    • As I have noted before, short term weight loss and improvement in health parameters are virtually identical for the very low carb keto diet and the very low-fat vegan diet.

With all this uncertainty you are probably wondering, “What is the truth about low carb diets?”

A recent study by the Cochrane Collaboration (CE Naude et al, Cochrane Database of Systematic Reviews, 28 January 2022) was designed to answer this question.

The Cochrane Collaboration is considered the gold standard of evidence-based medicine. To help you understand why this is, I will repeat a summary of how the Cochrane Collaboration approaches clinical studies that I shared two weeks ago.

Why Is The Cochrane Collaboration The Gold Standard?

ghost bustersWho you gonna call? It’s not Ghostbusters. It’s not Dr. Strangelove’s health blog. It’s a group called the Cochrane Collaboration.

The Cochrane Collaboration consists of 30,000 volunteer scientific experts from across the globe whose sole mission is to analyze the scientific literature and publish reviews of health claims so that health professionals, patients, and policy makers can make evidence-based choices about health interventions.

In one sense, Cochrane reviews are what is called a “meta-analysis”, in which data from numerous studies are grouped together so that a statistically significant conclusion can be reached. However, Cochrane Collaboration reviews differ from most meta-analyses found in the scientific literature in a very significant way.

Many published meta-analyses simply report “statistically significant” conclusions. However, statistics can be misleading. As Mark Twain said: “There are lies. There are damn lies. And then there are statistics”.

The Cochrane Collaboration also reports statistically significant conclusions from their meta-analyses. However, they carefully consider the quality of each individual study in their analysis. They look at possible sources of bias. They look at the design and size of the studies. Finally, they ask whether the conclusions are consistent from one study to the next. They clearly define the quality of evidence that backs up each of their conclusions as follows:

  • High-quality evidence. Further research is unlikely to change their conclusion. This is generally reserved for conclusions backed by multiple high-quality studies that have all come to the same conclusion. These are the recommendations that are most often adopted into medical practice.
  • Moderate-quality evidence. This conclusion is very likely to be true, but further research could have an impact on it.
  • Low-quality evidence. Further research is needed and could alter the conclusion. They are not judging whether the conclusion is true or false. They are simply saying more research is needed to reach a definite conclusion.

This is why their reviews are considered the gold standard of evidence-based medicine. If you are of a certain age, you may remember that TV commercial “When EF Hutton talks, people listen.” It is the same with the Cochrane Collaboration. When they talk, health professionals listen.

How Was The Study Done?

Clinical StudyThe authors of this Cochrane Collaboration Report included 61 published clinical trials that randomized participants into two groups.

  • The first group was put on a low carbohydrate diet (carbohydrates = <40% of calories).
  • The second group was put on a “normal carbohydrate” diet (carbohydrates = 45-65% of calories, as recommended by the USDA and most health authorities).
    • The normal carbohydrate diet was matched with the low carbohydrate diet in terms of caloric restriction.
    • Both diets were designed by dietitians and were generally whole food diets.

The participants in these studies:

  • Were middle-aged.
  • Were overweight or obese.
  • Did not have diagnosed heart disease or cancer.
  • May have diagnosed type-2 diabetes. Some studies selected participants that had diagnosed type 2 diabetes. Other studies excluded those patients.

The studies were of 3 types:

  • Short-term: Participants in these studies followed their assigned diets for 3 to <12 months.
  • Long-term: Participants in these studies followed their assigned diets for >12 to 24 months.
  • Short-term with maintenance: Participants in these studies followed their assigned diets for 3 months followed by a 9-month maintenance phase.

What Is The Truth About Low Carb Diets?

The TruthAll the studies included in the Cochrane Collaboration’s meta-analysis randomly assigned overweight participants to a low carbohydrate diet (carbohydrates = <40% of calories) or to a “normal carbohydrate” diet (carbohydrates = 45-65% of calories) with the same degree of caloric restriction.

If low carb diets have any benefit in terms of weight loss, improving blood sugar control, or reducing heart disease risk, these are the kind of studies that are required to validate that claim.

This is what the Cochrane Collaboration’s meta-analysis showed.

When they analyzed studies done with overweight participants without type 2 diabetes:

  • Weight loss was not significantly different between low carb and normal carb diets in short-term studies (3 to <12 months), long-term studies (>12 to 24 months), and short-term studies followed by a 9-month maintenance period.
  • There was also no significant difference in the effect of low carb and normal carb diets on the reduction in diastolic blood pressure and LDL cholesterol.

Since diabetics have trouble controlling blood sugar, you might expect that type 2 diabetics would respond better to low carb diets. However, when they analyzed studies done with overweight participants who had type 2 diabetes:

  • Weight loss was also not significantly different on low carb and normal carb diets.
  • There was no significant difference in the effect of low carb and normal carb diets on the reduction in diastolic blood pressure, LDL cholesterol, and hemoglobin A1c, a measure of blood sugar control.

Of course, the reason Cochrane Collaboration analyses are so valuable is they also analyze the strength of the studies that were included in their analysis.

You may remember in my article two weeks ago, I reported on the Cochrane Collaboration’s report supporting the claim that omega-3 supplementation reduces pre-term births. In that report they said that the studies included in their analysis were high quality. Therefore, they said their report was definitive and no more studies were needed.

This analysis was different. The authors of this Cochrane Collaboration report said that the published studies on this topic were of moderate quality. This means their conclusion is very likely to be true, but further research could have an impact on it.

What Does This Study Mean For You?

confusionIf you are a bit confused by the preceding section, I understand. That was a lot of information to take in. Let me give you the Cliff Notes version.

In short, this Cochrane Collaboration Report concluded:

  • Low carb diets (<40% of calories from carbohydrates) are no better than diets with normal carbohydrate content (45-65% of calories from carbohydrates) with respect to weight loss, reduction in heart disease risk factors, and blood sugar control. Dr. Strangelove has been misleading you again.
  • This finding is equally true for people with and without type 2 diabetes. This calls into question the claim that people with type 2 diabetes will do better on a low carb diet.
  • The published studies on this topic were of moderate quality. This means their conclusion is very likely to be true, but further research could have an impact on it.

If you are thinking this study can’t be true because low carb diets work for you, that is because you are comparing low carb diets to your customary diet, probably the typical American diet.

  • Remember that any whole food diet that eliminates sodas and processed foods and restricts the foods you eat will cause you to lose weight. Whole food keto and vegan diets work equally well short-term compared to the typical American diet.
  • And any diet that allows you to lose weight improves heart health parameters and blood sugar control.

If you are thinking about the blogs, books, and videos you have seen extolling the virtues of low carb diets, remember that the Dr. Strangeloves of the world only select studies comparing low carb diets to the typical American diet to support their claims.

  • The studies included in this Cochrane Collaboration report randomly assigned participants to the low carb and normal carb diets and followed them for 3 to 24 months.
    • Both diets were whole food diets designed by dietitians.
    • Both diets reduced caloric intake to the same extent.

What about the claims that low carb diets are better for your long-term health? There are very few studies on that topic. Here are two:

  • At the 6.4-year mark a recent study reported that the group with the lowest carbohydrate intake had an increased risk of premature death – 32% for overall mortality, 50% for cardiovascular mortality, 51% for cerebrovascular mortality, and 36% for cancer mortality. I will analyze this study in a future issue of “Health Tips From The Professor”.
  • At the 20-year mark a series of studies reported that:
    • Women consuming a meat-based low carb diet for 20 years gained just as much weight and had just as high risk of heart disease and diabetes as women consuming a high carbohydrate, low fat diet.
    • However, women consuming a plant-based low carb diet for 20 years gained less weight and had reduced risk of developing heart disease and diabetes as women consuming a high carbohydrate, low fat diet.

My recommendation is to avoid low-carb diets. They have no short-term benefits when compared to a healthy diet that does not eliminate food groups. And they may be bad for you in the long run. Your best bet is a whole food diet that includes all food groups but eliminates sodas, sweets, and processed foods.

However, if you are committed to a low carb diet, my recommendation is to choose the low-carb version of the Mediterranean diet. It is likely to be healthy long term.

The Bottom Line 

The Cochrane Collaboration, the gold standard of evidence-based medicine, recently issued a report that evaluated the claims made for low carb diets.

All the studies analyzed in the Cochrane Collaboration’s report randomly assigned overweight participants to a low carbohydrate diet (carbohydrates = <40% of calories) or to a “normal carbohydrate” diet (carbohydrates = 45-65% of calories) with the same degree of caloric restriction.

If low carb diets have any benefit in terms of weight loss, improving blood sugar control, or reducing heart disease risk, these are the kind of studies that are required to validate that claim.

The Cochrane Collaboration Report concluded:

  • Low carb diets (<40% of calories from carbohydrates) are no better than diets with normal carbohydrate content (45-65% of calories from carbohydrates) with respect to weight loss, reduction in heart disease risk factors, and blood sugar control.
  • This is equally true for people with and without type 2 diabetes.
  • The published studies on this topic were of moderate quality. This means their conclusion is very likely to be true, but further research could have an impact on it.

My recommendation is to avoid low carb diets. They have no short-term benefits when compared to a healthy diet that does not eliminate food groups. And they may be bad for you in the long run. Your best bet is a whole food diet that includes all food groups but eliminates sodas, sweets, and processed foods.

However, if you are committed to a low carb diet, my recommendation is to choose the low carb version of the Mediterranean diet. It is likely to be healthy long term.

For more details on the study and what it means for you, read the article above.

These statements have not been evaluated by the Food and Drug Administration. This information is not intended to diagnose, treat, cure, or prevent any disease.

Is It The Sugar Or Is It The Food?

Is Fructose Bad For You?

Author: Dr. Stephen Chaney

I don’t usually report on studies done in mice, but this study sheds light on a particularly puzzling question: Why is fructose bad for us?

The studies are clear-cut. High fructose consumption is associated with inflammation, obesity, non-alcoholic liver disease, insulin resistance, type 2 diabetes, kidney disease, increased LDL cholesterol and triglycerides, and heart disease. Based on these associations, fructose appears to be deadly. Why would anyone want to consume it?

Yet fructose is found in virtually every fruit. In fact, fructose, also known as fruit sugar, was first isolated from fruits. Hence the name fructose. Humans have been eating fruits safely for thousands of years. Fruits are very good for us. That raises the question: “If fruits are good for us, how can fructose be bad for us?”.

An important clue can be found by looking at what the food industry has done to the American diet. Because fructose imparts a pleasurable, sweet taste to foods the food industry keeps adding it to more and more foods. As a result, dietary intake of fructose has increased 100-fold over the past two centuries. It has reached the point where fructose now accounts for almost 10% of the caloric intake in the United States.

Is It The Sugar, Or Is It The Food?

Let me expand the discussion by using a couple of graphics I developed for my book, “Slaying The Food Myths”

There Are No Sugar Villains. There Are No Sugar Heroes:

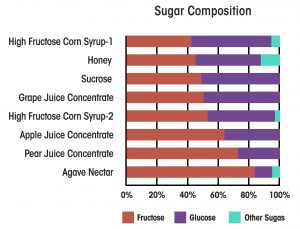
Sugar ComparisonsVirtually all sweeteners are primarily a mixture of fructose and glucose. The graphic on the left compares high fructose corn syrup (the current villain) with other “natural” sweeteners used in foods (our current heroes). High fructose corn syrup ranges from about 40% fructose to 55% fructose. The exact percentage depends on what kind of food product is being made with it.

Honey and coconut sugar are about 45% fructose. Sucrose and grape juice concentrate are around 50% fructose. Apple juice concentrate is around 60% fructose, and agave sugar comes in at a whopping 80% fructose.

In other words, if fructose is the culprit that everyone makes it out to be, “healthy” sugars are no better than high fructose corn syrup. Simply substituting a “healthy” sugar for high fructose corn syrup is unlikely to provide any meaningful benefit.

Is It The Sugar, Or Is The Food?

Apple With Nutrition LabelThis graphic shows us what a nutrition label would look like on a medium apple. I am sure that label is a wake-up call for many of you. The amount of sugar and the percentage of fructose and glucose are about the same as in an 8-ounce soda sweetened with high fructose corn syrup. The same is true for virtually every other fruit you can think of.

Now let me share one more thing you won’t hear from what I refer to as “Dr. Strangelove’s Health Blog” (You probably know the ones I am referring to). Virtually all the studies showing the bad effects of fructose consumption have been done with sodas and sugary junk foods. They haven’t been done with apples.

In fact, virtually every study looking at fruit and vegetable consumption has shown they are incredibly good for us. They lower inflammation and reduce the risk of obesity, diabetes, heart disease, and cancer. And the more the better. One study found that the health benefits of fruit and vegetable consumption topped out at around 10 servings a day.

With this background, you should now fully understand why the question “If fruits are good for us, how can fructose be bad for us?” is so perplexing.

My simplistic explanation has always been that whole foods like fruits have fiber, which slows the absorption of fructose from the intestine. Our bodies were designed to handle fructose in a safe manner when it enters the bloodstream slowly. It is taken up by the liver, converted to glucose, and then slowly metered back into the bloodstream. This provides our brain and other tissues with the glucose they need for energy without blood sugar spikes. This is how fructose is supposed to be metabolized by our bodies.

Sodas and junk foods, on the other hand, have little to slow the absorption of fructose. When lots of fructose enters the bloodstream rapidly, our “safe” metabolic pathways for handling it are overwhelmed, and it is forced into the pathways that are harmful. For example, the “excess” fructose is converted to fat by the liver, which causes inflammation, obesity, fatty liver disease, and triglyceride production.

This is, of course, simply my hypothesis for explaining the different effect of fructose in fruits and sodas. It is based on sound metabolic principles, but it is far from proven. That is why I found a recent study (C. Jang et al, Cell Metabolism, 27: 351-361, 2018) so interesting. It provides a metabolic rationale for my hypothesis.

How Was The Study Done?

Mice were fed a 1:1 mixture of fructose and glucose at doses that approximated the ranges of typical human fructose consumption. The fructose was isotopically labeled so that fructose and its metabolites could be identified by LC-MS (liquid chromatography – mass spectrometry). After feeding the mice the labeled fructose, the investigator measured the amount of fructose and its metabolites in various organs and in the portal vein, which transports sugars from the intestine to the liver for additional metabolism before they enter the bloodstream.

Is Fructose Bad For You?

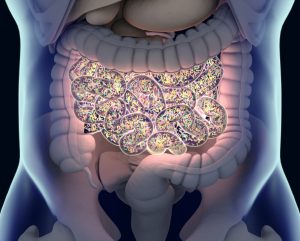
intestine & liverThe first surprise was that most of the fructose was metabolized by the intestinal mucosal cells that line the small intestine rather than the liver. Previous reports had assumed that fructose was primarily metabolized by the liver because that was where most of the bad effects of fructose metabolism had been observed.

These investigators observed that fructose was primarily converted to glucose and small molecular weight metabolites by the intestinal mucosal cells before being released into the portal vein, where they were transported to the liver. However, there was a strong dose response effect.

  • At low fructose doses, 90% of fructose was metabolized by intestinal mucosal cells before being released to the liver.
  • At high fructose doses, only 70% of fructose was metabolized by intestinal mucosal cells.
  • That means at high fructose doses the amount of fructose reaching the liver unchanged increases from 10% to 30%. That is a 3-fold increase!

The authors concluded:

  • “Based on these findings, we propose that the small intestine shields the liver from fructose and that excessive doses of fructose overwhelm the small intestine, spilling over to the liver where they cause toxicity.”
  • “A key difference between the health effects of fiber-rich fruits (and perhaps even fiber-rich prepared foods) and juices/sodas is their rate of intestinal fructose release.”
  • “It is likely that the appearance rate of free fructose in the small intestine plays a critical role in dictating its metabolic fate. Like the lower doses in our experiments, a slower rate of fructose appearance will result in more complete intestinal clearance, whereas higher doses and faster rates result in fructose overflow to the liver.”

This study needs to be confirmed, and the mechanism may be entirely different in humans. However, whether mechanism is the same in mice and humans is immaterial. We already know that fructose in sodas and junk foods exerts a very different effect on our health than fructose in fruits and other fiber-containing foods.

Despite what Dr. Strangelove tells you, fructose is not bad for you. It isn’t the problem. It is sodas and junk foods containing high-fructose corn syrup that are the problem. And substituting other sugars for high-fructose corn syrup doesn’t make them any better. As I showed you above, the so called “healthy” sugars are chemically and biologically indistinguishable from high-fructose corn syrup.

The Bottom Line

Previous studies have clearly shown that fructose in sodas and junk foods is bad for us, while fructose in fruits is good for us. A recent study in mice provides a metabolic explanation for this difference. The study found:

  • At low fructose doses, 90% of fructose was metabolized by intestinal mucosal cells before being released to the liver.
  • At high fructose doses, only 70% of fructose was metabolized by intestinal mucosal cells.
  • That means at high fructose doses the amount of fructose reaching the liver unchanged increases from 10% to 30%. That is a 3-fold increase!

The authors concluded:

  • “Based on these findings, we propose that the small intestine shields the liver from fructose and that excessive doses of fructose overwhelm the small intestine, spilling over to the liver where they cause toxicity.”
  • “A key difference between the health effects of fiber-rich fruits (and perhaps even fiber-rich prepared foods) and juices/sodas is their rate of intestinal fructose release.”
  • “It is likely that the appearance rate of free fructose in the small intestine plays a critical role in dictating its metabolic fate. Like the lower doses in our experiments, a slower rate of fructose appearance will result in more complete intestinal clearance, whereas higher doses and faster rates result in fructose overflow to the liver.”

This study needs to be confirmed, and the mechanism may be entirely different in humans. However, whether mechanism is the same in mice and humans is immaterial. We already know that fructose in sodas and junk foods exerts a very different effect on our health than fructose in fruits and other fiber-containing foods.

Despite what Dr. Strangelove tells you, fructose is not bad for you. It isn’t the problem. It is sodas and junk foods containing high-fructose corn syrup that are the problem. And substituting other sugars for high-fructose corn syrup doesn’t make them any better. As I showed you above, the so called “healthy” sugars are chemically and biologically indistinguishable from high-fructose corn syrup.

For more details, read the article above.

These statements have not been evaluated by the Food and Drug Administration. This information is not intended to diagnose, treat, cure, or prevent any disease.

Is Fructose Good For You Or Bad For You?

Is It The Fructose Or Is It The Food?

Author: Dr. Stephen Chaney

VillainFructose is the villain of the day. It is #1 on everyone’s “No-No” list. Almost every website, blog, and diet book demonize it. Even authors I highly respect say we should absolutely avoid it.

We are told it causes obesity, diabetes, heart disease, and non-alcoholic fatty liver disease – a disease that was unheard of only a few decades ago. We are told to read labels and avoid any foods with fructose or high-fructose corn syrup listed on their label.

But wait. Isn’t fructose a natural sugar? The answer is, “Yes”. It is the main sugar in fruit and many other naturally sweet whole foods. In fact, there is the same amount of fructose in an 8-ounce soda and a medium apple.

Does that mean that fruits are also bad for us? What is the truth?

Is It The Fructose Or Is It The Food?

AppleLet me put this into perspective for you. I have covered this in detail in a previous issue of Health Tips From The Professor. Here is a brief summary.

  • There are no sugar villains. There are no sugar heroes. Most of your favorite “natural” sugars are chemically and biologically indistinguishable from high-fructose corn syrup. Other natural sugars, like agave sugar, contain more fructose than high-fructose corn syrup.
  • All the studies showing the bad effects of fructose have been done with sodas and/or highly processed foods with added sugar. Let’s be clear. Those foods are bad for you.
  • Fruits, on the other hand, are good for you. You’ve heard the old adage, “An apple a day keeps the doctor away”. A recent study showed that isn’t just an “old wives’ tale”. It is true.

Why is that? Why is fructose in sodas and junk foods bad for us and fructose in fruits good for us?

Part of the answer is that fruits are high in fiber, which slows the release of fructose into the intestine as fruits are digested. In addition, the fructose in fruits is trapped in a cellular matrix, which also slows the release of fructose during digestion.

Sodas and highly processed foods, on the other hand, have nothing to slow the release of fructose. It is immediately available as soon as the food reaches the intestine.

A recent study sheds light on why the rate of fructose release in our intestine may be important. The study showed:

  • When fructose is released slowly our bodies know exactly what to do with it.
    • Most of it is metabolized by the cells that line our intestine, and the rest is metabolized by the liver.
    • In both cases fructose is converted to glucose and slowly released into the bloodstream.
    • This stabilizes blood sugar levels.
  • When fructose is released quickly our bodies are overwhelmed and bad things happen.
    • The intestine passes the excess on to the liver, and the liver converts it to fat rather than glucose.
    • The fat is stored in the liver.
    • This leads to insulin resistance, diabetes, heart disease, and fatty liver disease.

But could the fiber in fruits have other beneficial effects such as supporting populations of beneficial gut bacteria? The study ( J Beisner et al, Nutrients, 12: 3444, 2020) I will focus on today suggests the answer is yes.

How Was The Study Done?

Clinical StudyInvestigators from the University of Hohenheim, Germany recruited 12 healthy female volunteers, ages 20 – 40 (average age = 28).

Each of the subjects was given a series of diets to follow for one week each.

  • Week one was a low fructose diet (10 g of fructose/day). For this diet phase subjects had to avoid sweets, highly processed foods, sodas, and fruits and vegetables containing more than 1 g of fructose per serving.
  • Week two was a high fructose fruit diet (100 g of fructose/day). This diet phase emphasized fructose-rich fruits and vegetables. Sweets, highly processed foods, and sodas had to be avoided.
  • Week three was a repeat of the low fructose diet (10 g of fructose/day).
  • Week four was a high-fructose corn syrup diet (100 g of fructose/day). For this diet phase subjects had to sweeten the food they were eating with a measured amount of high-fructose corn syrup. They also had to avoid fructose-rich fruits and vegetables.

The diets were designed to have around 2,000 calories/day and to have the same amounts of fat (30% of calories), protein (15% of calories), and carbohydrate (55% of calories). However, the fiber content of the diets was very different (around 17 g/day on the low fructose and high-fructose corn syrup diets and around 38 g/day on the high fructose fruit diet).

The subjects were given detailed instructions and training before starting on the 4-week program. They also kept a daily dietary record of everything they ate and drank so the investigators would know how closely they stuck to their dietary instructions.

This experimental design was based on previous studies showing that populations of gut bacteria change within 24-48 hours when you go on a new diet. Stool samples were collected at the end of each week and analyzed for gut bacteria.

Is Fructose Good For You Or Bad For You?

MicrobiomeThe study showed:

  • Consumption of a high-fructose, fruit-rich diet resulted in:
    • An increase in beneficial butyrate-producing bacteria (more about that below).
    • A decrease in bacteria associated with elevated total and LDL cholesterol.
    • Decreased blood levels of total and LDL cholesterol.
  • Consumption of a high-fructose corn syrup diet had the opposite effect. It resulted in:
    • A decrease in beneficial butyrate-producing bacteria.
    • An increase in bacteria associated with elevated total and LDL cholesterol.
    • Increased blood levels of total and LDL cholesterol.

The authors concluded: “We provide evidence that the high-fructose corn syrup diet induces an imbalanced microbiota [gut bacteria] profile characterized by a significantly reduced abundance of beneficial butyrate-producing bacteria and of bacteria known for anti-obesity effects…Despite the high fructose content, the fruit-rich diet shifts the intestinal microbiota composition in a protective manner…”

The authors said that there were probably two mechanisms for the different effects of fructose in high-fructose corn syrup and in fruits.

  • The fiber found in fruit supports the growth of beneficial bacteria in our intestine.
  • When high-fructose corn syrup is present in foods with low fiber content, it is released rapidly in the intestine. As I noted above, the cells that line our intestine become overwhelmed and pass some of that excess fructose on to our liver. However, the authors cited previous studies showing that some of that excess fructose remains in our intestine and supports the growth of unhealthy bacteria.

What Does Butyrate Do?

Question MarkYou are probably wondering what is special about butyrate-producing bacteria. Here is a brief synopsis.

  • Butyrate is a short chain fatty acid. As you might expect from its name, it was originally identified as a constituent of butter.
  • Some species of gut bacteria convert the fats in our diet to butyrate.
    • It is used as a preferred energy source for the cells that line our intestine. Consequently, butyrate production in our intestines has been linked to:
      • Reduced inflammation of the cells lining our intestine, which reduces the risk for diseases like inflammatory bowel disease (IBS) and Crohn’s Disease.
      • Reduced risk of “leaky gut syndrome”.
      • Reduced risk of colon cancer.
    • It is also absorbed into the bloodstream and appears to affect several metabolic pathways. For example, butyrate production in the intestine is associated with:
      • Decreased cholesterol levels.
      • Improved blood sugar control.
      • A healthy body weight.

What Does This Mean For You?

Questioning ManThis was a small study. As the authors noted, larger studies of longer duration are needed to confirm that the effects of fructose on our gut bacteria depend on the food the fructose is in. However, several other studies have come to similar conclusions.

More importantly, this study merely shows that the effect of fructose-containing foods on our gut bacteria is a potential mechanism for explaining why the effect of fructose depends on the food it is in.

There is already overwhelming evidence that fructose in fruits is good for us, while high-fructose corn syrup in sodas and highly processed foods is bad for us.

Does that mean high-fructose corn syrup is villainous? Should we read labels and avoid any food containing high-fructose corn syrup?

I would remind you that the amount of fructose and the relative abundance of fructose and glucose are virtually identical in fruits and high-fructose corn syrup. It is not high-fructose corn syrup that is the problem, it is the foods it is found in.

We don’t need to become compulsive label readers. We just need to eat more foods without labels.

The Bottom Line 

High-fructose corn syrup has been vilified in recent years. However, there is increasing evidence that it is not fructose that is the problem. It is the foods it is found in.

A recent study was designed to test that hypothesis. The investigators fed subjects high fructose diets in which the fructose came either from fruits or high-fructose corn syrup. The amount of fructose was identical in the two diets. The investigators then asked what effect the two diets had on gut bacteria. In short:

  • Consumption of the high-fruit diet increased healthy levels of beneficial gut bacteria and suppressed levels of unhealthy gut bacteria.
  • Consumption of the high-fructose corn syrup diet had the opposite effect. It increased unhealthy bacteria and suppressed beneficial bacteria.

The authors concluded: “We provide evidence that the high-fructose corn syrup diet induces an imbalanced microbiota [gut bacteria] profile characterized by a significantly reduced abundance of beneficial…bacteria and of bacteria known for anti-obesity effects…Despite the high fructose content, the fruit-rich diet shifts the intestinal microbiota composition in a protective manner…”

My take is as follows: This study shows that the effect of fructose-containing foods on our gut bacteria is a potential mechanism for explaining why the effect of fructose depends on the food it is in.

There is already overwhelming evidence that fructose in fruits is good for us, and high-fructose corn syrup in sodas and highly processed foods is bad for us.

Does that mean that high-fructose corn syrup is villainous? Should we read labels and avoid any food containing high-fructose corn syrup?

I would remind you that the amount of fructose and the relative abundance of fructose and glucose is virtually identical in fruits and high-fructose corn syrup. It is not high-fructose corn syrup that is the problem, it is the foods it is found in.

We don’t need to become compulsive label readers. We just need to eat more foods without labels.

For more details read the article above.

These statements have not been evaluated by the Food and Drug Administration. This information is not intended to diagnose, treat, cure or prevent any disease.

Does Vitamin D Prevent Type 1 Diabetes?

Does Genetics Influence Supplementation Benefits?

diabetesThe cause of type 1 diabetes is a mystery. If you go to an authoritarian source like the Mayo Clinic, you will discover that:

  • Type 1 diabetes is an autoimmune disease that selectively attacks the insulin-producing islet cells of the pancreas.
  • Certain genetic variants predispose individuals to type 1 diabetes.
  • The autoimmune response may be triggered by a viral infection or other unknown environmental factors in genetically susceptible individuals.
  • The incidence of type 1 diabetes increases as you travel away from the equator, which suggests that vitamin D may be involved.

The idea that vitamin D may be involved is an important concept because it suggests that vitamin D supplementation might reduce the risk of developing type 1 diabetes. This idea was reinforced by a Finnish study (E Hyponnen et al, Lancet, 358: 1500-1503, 2001) published in 2001 showing the vitamin D supplementation of newborn infants reduced the incidence of type 1 diabetes at age 1.

However, subsequent studies in other parts of the world have had mixed results. Some have confirmed the results of the Finnish study. Others have come up empty.

Similarly, some studies have shown a correlation between low 25-hydroxyvitamin D levels in the blood and the development of type 1 diabetes in children, while other studies have found no correlation.

Why the discrepancy between studies? Some of the differences can be explained by differences in the populations studied or differences in study design. But what if there were another variable that none of the previous studies has considered?

The study (JM Norris et al, Diabetes, 67: 146-154, 2018) I review this week describes just such a variable. The authors of the study hypothesized that the association between 25-hydroxyvitamin D levels and the risk of developing type 1 diabetes is influenced by mutations that affect the way vitamin D works in the body. Previous studies have not taken these mutations into account. If the author’s hypothesis is true, it might explain why these studies have produced conflicting results.

In this article, I will answer 3 questions:

  • Does vitamin D prevent type 1 diabetes?
  • If so, is supplementation with vitamin D important?
  • Who will benefit most from vitamin D supplementation?

But, before I answer those questions, I should begin by providing some background. I will start by reviewing the how diet, increased need, disease, and genetics influence the likelihood that we will benefit from supplementation. Then I will review vitamin D metabolism.

Does Genetics Influence Supplementation Benefits?

need for supplementsThe reason so many studies find no benefit from supplementation is that they are asking the wrong question. They are asking “Does supplementation benefit everyone?” That is an unrealistic expectation.

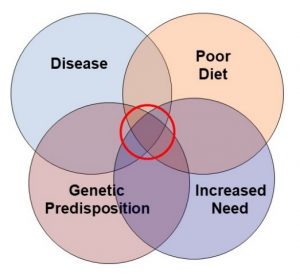
I have proposed a much more realistic model (shown on the left) for when we should expect supplementation to be beneficial. Simply put, we should ask:

  • Is the diet inadequate with respect to the nutrient that is being studied?
  • Is there an increased need for that nutrient because of age, gender, activity level, or environment?
  • Is there a genetic mutation that affects the metabolism or need for that nutrient?
  • Is there an underlying disease state that affects the need for that nutrient?

When clinical studies are designed without taking this paradigm into account, they are doomed to fail. Let me give you some specific examples.

  • The Heart Outcomes Prevention Evaluation study concluded supplementation with folate and other B vitamins did not reduce heart disease risk. The problem was that 70% of the people in the study were getting adequate amounts of folate from their diet at the beginning of the study. For those individuals not getting enough folate in their diet, B vitamin supplementation decreased their risk of heart disease by 15%. This is an example of poor diet influencing the need for supplementation.

The other three examples come from studies on the effect of vitamin E supplementation on heart disease that I summarized in an article in “Health Tips From The Professor” a few years ago. Here is a brief synopsis.

  • The Women’s Health Study concluded that vitamin E did not decrease heart disease risk in the general population. However, the study also found that in women over 65 (who are at high risk of heart disease), vitamin E supplementation decreased major cardiovascular events and cardiovascular deaths by 25%. This is an example of increased need because of age and gender influencing the need for supplementation.
  • The Women’s Antioxidant Cardiovascular Study” concluded that vitamin E did not decrease heart disease risk in the general population. However, when they looked at women who already had cardiovascular disease at the beginning of the study, vitamin E supplementation decreased risk of heart attack, stroke, and cardiovascular death by 23%. This is an example of an underlying disease affecting the need for supplementation.
  • The HOPE study concluded that vitamin E did not decrease heart disease risk in the general population. However, when they looked at individuals with a mutation that increases the risk of heart disease, vitamin E supplementation significantly decreased their risk of developing heart disease. This is an example of genetics affecting the need for supplementation.

These are just a few of many examples. When you ask whether supplementation benefits everyone, the answer is often no. However, when you look at people with inadequate diet, increased need, underlying disease, and/or genetic predisposition, the answer is often yes.

This background sets the stage for the current study. Of course, to understand the author’s hypothesis that mutations in genes involved in vitamin D metabolism might influence the effect of vitamin D on the risk of developing type 1 diabetes, you need to know a little about vitamin D metabolism.

Biochemistry 101: Vitamin D Metabolism

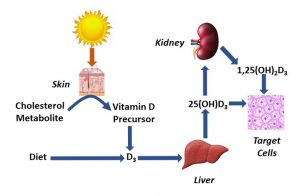
Vitamin D MetabolismWhen sunlight strikes a metabolite of cholesterol in our skin, it is converted to a precursor that spontaneously isomerizes to form vitamin D3. Because this series of reactions is usually not sufficient to provide all the vitamin D3 our bodies require, we also need to get vitamin D3 from diet and supplementation.

However, vitamin D3 is not active by itself. It first needs to be converted to 25-hydroxyvitamin D by our liver and then to the active 1,25-dihydroxyvitamin D. 1,25-dihydroxyvitamin D is an important hormone that regulates many cells in our body.

Some of the 1,25-dihydroxyvitamin D is synthesized by our kidneys and released into the bloodstream. This 1,25-dihyroxyvitamin D binds to vitamin D receptors on the surface of many cells and initiates regulatory pathways that affect metabolism inside the cell.

Other cells take up 25-hydroxyvitamin D and convert it to 1,25-dihydroxyvitamin D themselves. In these cells both the synthesis and regulatory effects of 1,25-dihydroxyvitamin D occur entirely inside the cell.

In both cases, it is 1,25-dihydroxyvitamin D that regulates cellular metabolism. The only difference is the way this regulation is accomplished.

There are two additional points that are relevant to this study.

  • The efficiency of conversion of vitamin D to 25-hydroxyvitamin D varies from person to person.
    • Thus, blood levels of 25-hydroxyvitamin D are considered a more reliable measure of vitamin D status than dietary intake of vitamin D or sun exposure.
    • Blood levels of 25-hydroxyvitamin D levels ≥50 nmol/L are considered optimal, while levels of 30 to <50 nmol/L are considered suboptimal, and levels <30 nmol/L are considered deficient.
  • 1,25-dihydroxyvitamin D binds to the vitamin D receptor on immune cells. This initiates a series of reactions that decrease the risk of autoimmune responses by our immune system.

How Was This Study Done?

Clinical StudyThis study was called TEDDY (The Environmental Determinants Of Type 1 Diabetes in the Young). Between September 2004 and February 2010, 424,788 newborn infants from 6 medical centers in Colorado, Georgia, Washington, Finland, Germany, and Sweden were screened for genes that predispose to type 1 diabetes.

The investigators identified 21,589 high-risk infants, and 8,676 of them were enrolled in this study before age 4 months. Clinic visits for the children occurred every 3 months between 3 and 48 months of age and every 6 months thereafter.

  • A DNA sample was taken at the time they entered the study and analyzed for mutations in genes involved in vitamin D metabolism.
  • 25-hydroxy vitamin D levels were obtained at each office visit. Because some studies have suggested the vitamin D status during the first year of life is important, the data were analyzed in two ways.
    1. An average of all 25-hydroxyvitamin D levels (referred to as “childhood 25-hydroxyvitamin D levels”).
    1. An average of 25-hydroxyvitamin D levels during the first 12 months (referred to as “early infancy 25-hydroxyvitamin D levels”).
  • Serum autoantibodies to pancreatic islet cells were measured at each office visit as a measure of an autoimmune attack on those cells. Persistent autoimmune response was defined as positive autoantibodies on two consecutive office visits.

While this study did not directly measure type 1 diabetes, children with an autoimmune response to their pancreatic islet cells are highly likely to develop type 1 diabetes. Thus, for purposes of simplicity I will refer to “risk of developing type 1 diabetes” rather than “persistent autoimmune response” in describing these results.

    1. 418 children developed persistent autoantibodies to their pancreatic islet cells during the study. The onset of this autoimmune response ranged from 2 months to 72 months with an average of 21 months.
    1. These children were compared to 3 matched controls from their medical center who did not develop an autoimmune response.

This study was remarkable for two reasons:

1) It was much larger than previous studies. This gave it greater power to detect an effect of vitamin D status on the risk of developing type 1 diabetes.

2) This was the first study to ask whether mutations in genes controlling the metabolism of vitamin D influenced the effect of vitamin D on the risk of developing type 1 diabetes.

Does Vitamin D Prevent Type 1 Diabetes?

Vitamin DThe study compared the risk of developing type 1 diabetes in children whose 25-hydroxyvitamin D levels were optimal (≥50 nmol/L) to children whose 25-hydroxyvitamin D levels were suboptimal (30 to <50 nmol/L). The results were:

  • Optimal vitamin D status during childhood was associated with a 31% decrease in the risk of developing type 1 diabetes.
  • Optimal vitamin D status during early infancy (first 12 months) was associated with a 40% decrease in the risk of developing type 1 diabetes.

In other words, having optimal vitamin D status significantly reduces the likelihood of developing of type 1 diabetes in childhood.

  • 25-hydroxyvitamin D levels >75 nmol/L provided no additional benefit.

In other words, you need sufficient vitamin D, but higher levels provide no additional benefit.

  • They tested 5 genes involved in vitamin D metabolism to see if they influenced the effect of vitamin D on the risk of developing type 1 diabetes. Only the VDR (vitamin D receptor) gene had any influence.
    • When the VDR gene was fully functional, optimal vitamin D status had no effect on the risk of developing type 1 diabetes. This means that even suboptimal (30 to <50 nmol/L) levels of 25-hydroxyvitamin D were sufficient to prevent type 1 diabetes when the vitamin D receptor was fully functional.
    • Only 9% of the children in this study were vitamin D deficient (<30 nmol/L 25-hydroxyvitamin D). Presumably, these children would be at high risk of developing type 1 diabetes even with a fully functional VDR gene. However, there were not enough children in that category to test this hypothesis.
  • When they looked at children with mutations in the VDR gene:
    • Optimal vitamin D status during childhood was associated with a 59% decrease in the risk of developing type 1 diabetes.
    • Optimal vitamin D status during early infancy (first 12 months) was associated with a 67% decrease in the risk of developing type 1 diabetes.

In short, the need for optimal vitamin D levels to reduce the risk of developing type 1 diabetes is only seen in children with a mutation in the VDR (vitamin D receptor) gene.

  • This is a clear example of genetics affecting the need for a nutrient.
    • For children with a fully functional VDR gene, even 30-50 nmol/L 25-hydroxyvitamin D was sufficient to reduce the risk of developing type 1 diabetes.
    • However, children with mutations in the VDR gene required ≥50 nmol/L 25-hydroxyvitamin D to reduce their risk of developing type 1 diabetes.
  • This is also an example of genetics affecting the need for supplementation with vitamin D.
    • 42% of the children in this study had suboptimal levels of 25-hydroxyvitamin D. Those who also have a mutation in the VDR gene would require supplementation to bring their 25-hydroxyvitamin D up to the optimal level to reduce their risk of developing type 1 diabetes.
    • Other studies have estimated that up to 61% of children in the US may have suboptimal 25-hydroxyvitamin D levels.

What Does This Study Mean For You?

Questioning WomanLet’s start with the three questions I proposed at the beginning of this article.

1) Does vitamin D prevent type 1 diabetes? Based on this study, the answer appears to be a clear yes. However, this is the first study of this kind. We need more studies that into account the effect of mutations in the VDR gene.

2) If so, is supplementation with vitamin D important? If we think in terms of supplementation with RDA levels of vitamin D or sufficient vitamin D to bring 25-hydroxyvitamin D into the optimal range, the answer is also a clear yes. However, there is no evidence from this study that higher doses of vitamin D provide additional benefits.

3) Who will benefit most from vitamin D supplementation? Based on this study, the children who will benefit the most from vitamin D supplementation are those who have a suboptimal vitamin D status and have a mutation in the VDR (vitamin D receptor) gene. To put this into perspective:

    • Up to 60% of children and adults in this country have suboptimal vitamin D levels.
    • The percentage of suboptimal vitamin D levels is highest for people who are obese, have pigmented skin, are institutionalized (eg, elderly in nursing homes), and/or live far from the equator.
    • Supplementation with a multivitamin containing the RDA for vitamin D reduces the risk of having suboptimal vitamin D status by 2.5 to 5-fold depending on the person’s ethnicity.
    • This study may be just the tip of the iceberg. The vitamin D receptor is also found on many other cells that control important biological functions.

Finally, if you are a parent or parent-to-be, you probably have several questions. Here are the ones I have New Parentsanticipated:

#1: Is my child at risk for developing type 1 diabetes? If you or a close family member has type 1 diabetes, you can assume your child is genetically predisposed to developing type 1 diabetes. Other factors that increase your child’s risk of developing type 1 diabetes are obesity, non-White ethnicity, and geographical location far from the equator.

#2: Should I have my baby tested for genetic predisposition to type 1 diabetes? That is not currently recommended. Just be aware of the risk factors listed above.

#3: Should I have my baby tested for VDR mutations? That is unnecessary. If your child has a VDR mutation, they just need sufficient vitamin D, not mega doses of vitamin D. And there are lots of other reasons for making sure your child gets sufficient vitamin D.

#4: How much vitamin D should my child be getting? The recommendation is 400 IU up to age 1 and 600 IU over age 1.

#5: Should I give my child vitamin D supplements? It is a good idea. For children over age 1, I recommend a multivitamin supplying 600 IU of vitamin D.

For infants, the American Association of Pediatrics recommends 400 IU vitamin D drops, regardless of whether the infants are breast or formula fed. That is because studies during the first year of life show that less than one-fifth of all infants get the recommended 400 IU/d from any source, and fewer than one out of 10 breast-fed infants meet the requirement – even if the mother is getting adequate vitamin D in their diet.

One Caution: I do not recommend exceeding 400 IU for infants or 600 IU for children unless directed by your health care provider. In terms of the risk of developing type 1 diabetes, your child needs sufficient vitamin D, and more is not better.

#6: Should I have my child tested for 25-hydroxyvitamin D levels? That is not done routinely at the present time. However, if your child has one or more of the risk factors listed above, it is a conversation you should have with your health care provider.

The Bottom Line

While it is widely accepted that vitamin D helps reduce the risk of developing type 1 diabetes in childhood, that has been difficult to prove. Clinical studies have provided conflicting results. The authors of a recent study postulated that the discrepancies between studies may have arisen because the studies neglected the effect of mutations in genes controlling vitamin D metabolism which may affect the ability of vitamin D to reduce the risk of developing type 1 diabetes.

This study found that:

1) Infants and children with optimal vitamin D status (25-hydroxyvitamin D levels ≥50 nmol/L) were 31-40% less likely to develop type 1 diabetes than children with suboptimal vitamin D status (25-hydroxyvitamin D = 30 to <50 nmol/L).

2) However, the effect of vitamin D on the risk of developing type 1 diabetes was only seen in children with one or more mutations in the VDR (vitamin D receptor) gene. To interpret this observation, you need to know that:

    • Type 1 diabetes is caused by an autoimmune attack on the pancreatic islet cells that release insulin.
    • 1,25-dihydroxyvitamin D promotes immune tolerance and decreases the risk of autoimmune responses.
    • 1,25-dihydroxyvitamin D exerts this effect by binding to the vitamin D receptor on the surface of immune cells.

3) Thus, mutations in the VDR gene modify the effect of vitamin D on the risk of developing type 1 diabetes. Specifically:

    • When the VDR gene is fully active, even suboptimal levels of vitamin D appear to be sufficient to prevent the development of type 1 diabetes in childhood.
    • However, when the VDR gene has mutations that reduce its activity, suboptimal levels of vitamin D no longer prevent type 1 diabetes. Optimal levels of vitamin D are required to reduce the risk of developing type 1 diabetes.

This is an example of genetics increasing the need for a nutrient (vitamin D) and increasing the need for supplementation to make sure that optimal levels of that nutrient are achieved.

While this study focused on the effect of vitamin D on the development of type 1 diabetes, this may just be the tip of the iceberg. The vitamin D receptor is also found on many other cells that control important biological functions.

For more details, read the article above. You will probably want to read the section “What Does This Mean For You?”, including my recommendations for parents of young children

These statements have not been evaluated by the Food and Drug Administration. This information is not intended to diagnose, treat, cure, or prevent any disease.

Why Do Diet Sodas Make You Fat?

Is Mixing Diet Sodas With Carbs Bad For You?

Why Do Sodas Cause Obesity?Many people, and many doctors, believe that diet sodas and artificially sweetened foods are a healthy choice. After all:

  • Cutting calories by drinking diet sodas and eating artificially sweetened foods should help you lose weight.
  • If sugar is the problem for diabetics, diet sodas and artificially sweetened foods should be a healthier choice.

On the surface, these ideas appear to be self-evident. They seem to be “no-brainers”. The truth, however, is more complicated.

When studies are tightly controlled by dietitians so that the people consuming diet sodas don’t add any extra calories to their diet, the results are exactly as expected. People consuming diet sodas lose weight compared to people drinking regular sodas.

However, as I have described in an earlier issue of “Health Tips From the Professor”, the results are different in the real world where you don’t have a dietitian looking over your shoulder. In those studies, diet sodas are just as likely to cause weight gain as regular sodas.

As Barry Popkin, a colleague at the University of North Carolina, put it” “The problem is that we [Americans] are using diet sodas to wash down our Big Macs and fries.” In short, people drinking diet sodas tend to increase their caloric intake by adding other foods to their diet. Even worse, the added foods aren’t usually fruits and vegetables. They are highly processed junk foods.

Why is that? The short answer is that nobody knows (more about that later). However, a recent study (JR Dalenberg et al, Cell Metabolism, 31: 493-502, 2020) suggests an unexpected mechanism for the weight gain associated with diet soda consumption. Let’s look at that study.

How Was The Study Done?

Clinical StudyThe study recruited 45 healthy young adults (ages 20-45) who habitually consumed less than 3 diet sodas a month. They were randomly assigned to three groups. The participants in each group came into the testing facility seven times over a span of 2 weeks. Each time they were given 12 ounces of one of three equally sweet tasting beverages in a randomized, double-blind fashion.

  • Group 1 received a sucralose-sweetened drink contained 0.06 grams of sucralose (equivalent to two packets of Splenda).
  • Group 2 received a sugar-sweetened drink contained 7 teaspoons of sucrose (table sugar).
  • Group 3 received a combo drink contained 0.06 grams of sucralose plus 7 teaspoons of maltodextrin. Maltodextrin is a water-soluble carbohydrate that does not have a sweet taste.

o   Maltodextrin was used because Splenda and most other commercial sucralose products contain it along with sucralose. You need something to fill up those little sucralose-containing packets.

o   This drink was included as a control. The expectation was that it would give the same results as the sucralose-sweetened drink.

Three measurements were performed prior to and following the 2-week testing period:

  • An oral glucose tolerance test in which participants drink a beverage containing a fixed amount of glucose. Then their blood sugar and blood insulin levels are measured over the next two hours.

o   This is a measure of how well they were able to control their blood sugar levels.

  • A test in which they were given samples that had either a sweet, sour, salty, or savory taste. Then:

o   They were asked to identify each taste and report how strong the taste was.

o   MRI scans of their brains were performed to determine how strongly their brains responded to each of the tastes.

Is Mixing Diet Soda With Carbs Bad For You?

The results were surprising. The first surprise came when the investigators unblinded the results of the oral glucose tolerance test:

  • Blood sugar and blood insulin responses were unaffected by the 2-week exposure to sugar-sweetened drinks.

o   This was expected.

  • Blood sugar and blood insulin were relatively unaffected by the 2-week exposure to sucralose-sweetened drinks. If anything, the control of blood sugar levels was slightly improved at the end of two weeks.

o   This was a disappointment for the investigators. One of the prevailing theories is that artificially sweetened beverages alter the blood sugar response. The investigators found no evidence for that idea.

  • Following the 2-week exposure to the combo drinks (sucralose plus maltodextrin), blood sugar levels were unaffected, but blood insulin levels were increased. This implies that more insulin was required to control blood sugar levels. In other words, these participants had developed insulin resistance.

o   This result was unexpected. Remember the investigators had included this drink as a control.

o   The investigators pointed out that the insulin resistance associated with the sucralose-maltodextrin combo could increase the risk of type 2 diabetes and obesity.

  • Because of this unexpected result, the investigators did a follow-up study in which participants were given a maltodextrin-only drink using the same study protocol. The oral glucose tolerance test was unchanged by the 2-week exposure to maltodextrin-only drinks.

When the investigators conducted taste tests, the ability of participants to taste all four flavors was unchanged by a 2-week exposure to any of the drinks.

However, when the investigators did MRI scans to measure the brain’s response to these flavors:

  • A two-week exposure to the sucralose plus maltodextrin drinks reduced the brain’s response to sweet but not to any of the other flavors.

o   In other words, the subjects could still taste sweet flavors, but their brains were not responding to the sweet taste. Since sweetness activates pleasure centers in the brain this could lead to an increased appetite for sweet-tasting foods.

o   This might explain the weight gain that has been observed in many previous studies of diet sodas.

  • Two-week exposures to the other drinks had no effect on the brain’s response to any of the flavors. Once again, this effect was only seen in the sucralose-maltodextrin combination.

The investigators concluded:

  • “Consumption of sucralose combined with carbohydrates impairs insulin sensitivity…and…neural responses to sugar.
  • Insulin sensitivity is not altered by sucralose or carbohydrate consumption alone.
  • The results suggest that consumption of sucralose in the presence of a carbohydrate dysregulates gut-brain regulation of glucose metabolism.”

The investigators pointed out that this could have several adverse consequences. Again, in the words of the authors:

“Similar exposure combinations (artificial sweeteners plus carbohydrates) almost certainly occur in free-living humans, especially if one considers the consumption of a diet drink along with a meal. This raises the possibility that the combination effect may be a major contributor to the rise in incidence of type 2 diabetes and obesity. If so, addition of artificial sweeteners to increase the sweetness of carbohydrate-containing food and beverages should be discouraged and consumption of diet drinks with meals should be counseled against.”

Why Do Diet Sodas Make You Fat?

As I mentioned at the start of this article, there are a lot of hypotheses as to why diet sodas make us fat. These hypotheses break down into two classifications: psychological and physiological.

The psychological hypothesis is easiest to explain. Essentially, it goes like this: We feel virtuous for choosing a zero-calorie sweetener, so we allow ourselves to eat more of our favorite foods. It is unlikely that this hypothesis holds for all diet soda drinkers. However, it is also hard to exclude it as at least part of the explanation for the food overconsumption associated with diet soda use.

There are multiple physiological hypotheses. Most of them are complicated, but here are simplified explanations of the three most popular hypotheses:

  • The sweet taste of artificial sweeteners tricks the brain into triggering insulin release by the pancreas. This causes blood sugar levels to plummet, which increases appetite.
  • The sweet taste of artificial sweeteners is not appropriately recognized by the brain. This diminishes release of hormones that suppress appetite.
  • Artificial sweeteners interfere with insulin signaling pathways, which leads to insulin resistance.

There is some evidence for and against each of these hypotheses.

However, this study introduces a new physiological hypothesis – namely that it is the combination of artificial sweeteners and carbohydrates that results in a dysregulation of the normal mechanisms controlling appetite and blood sugar.

What Does This Study Mean For You?

Diet Soda DangersLet’s start with the obvious. This is just a hypothesis.

  • This was a very small study. Until it is confirmed by other, larger studies, we don’t know whether it is true.
  • This study only tested sucralose. We don’t know whether this applies to other artificial sweeteners.
  • The study only tested maltodextrin in combination with sucralose. We don’t know whether it applies to other carbohydrates.

Therefore, in discussing how this study applies to you, let’s consider two possibilities – if it is true, and if it is false.

If this hypothesis is true, it is concerning because:

  • We often consume diet sodas with meals. If, for example, we take the earlier example of a diet soda with a Big Mac and fries, both the hamburger bun and the fries are high carbohydrate foods.


  • Sucralose and other artificial sweeteners are used in low calorie versions of many carbohydrate rich processed foods.

If this hypothesis is false, it does not change the underlying association of diet soda consumption with weight gain and type 2 diabetes. It is merely an attempt to explain that association. We should still try to eliminate diet sodas and reduce our consumption of artificially sweetened, low calorie foods.

My recommendation is to substitute water and other unsweetened beverages for the diet drinks or sugar sweetened beverages you are currently consuming. If you crave the fizz of sodas, drink carbonated water. If you need more taste, try herbal teas or infuse water with slices of lemon, lime, or your favorite fruit. If you buy commercial brands of flavored water, check the labels carefully. They may contain sugars or artificial sweeteners. Those you want to avoid.

The Bottom Line

Many studies have called into question the assumption that diet sodas and diet foods help us lose weight. In fact, most of these studies show that diet soda consumption is associated with weight gain rather than weight loss.

There are many hypotheses to explain this association, but none of them have been proven at present.

This study introduces a new hypothesis – namely that the combination of artificial sweeteners and carbohydrates results in a dysregulation of the normal mechanisms controlling appetite and blood sugar. In particular, this study suggested that combining sucralose with carbohydrates caused insulin resistance and reduce the ability of the brain to respond appropriately to sweet tastes.

The authors concluded: “Similar exposure combinations (artificial sweeteners plus carbohydrates) almost certainly occur in free-living humans, especially if one considers the consumption of a diet drink along with a meal. This raises the possibility that the combination effect may be a major contributor to the rise in incidence of type 2 diabetes and obesity. If so, addition of artificial sweeteners to increase the sweetness of carbohydrate-containing food and beverages should be discouraged and consumption of diet drinks with meals should be counseled against.”

If this hypothesis is true, it is concerning because:

  • We often consume diet sodas with meals. If, for example, we take the example of a diet soda with a Big Mac and fries, both the hamburger bun and the fries are high carbohydrate foods.
  • Artificial sweeteners are used in low calorie versions of many carbohydrate rich processed foods.

If this hypothesis is false, it does not change the underlying association of diet soda consumption with weight gain and type 2 diabetes. It is merely an attempt to explain that association. We should still try to eliminate diet sodas and reduce our consumption of artificially sweetened, low calorie foods.

My recommendation is to substitute water and other unsweetened beverages for the diet drinks or sugar sweetened beverages you are currently consuming. If you crave the fizz of sodas, drink carbonated water. If you need more taste, try herbal teas or infuse water with slices of lemon, lime, or your favorite fruit. If you buy commercial brands of flavored water, check the labels carefully. They may contain sugars or artificial sweeteners. Those you want to avoid.

For more details, read the article above.

These statements have not been evaluated by the Food and Drug Administration. This information is not intended to diagnose, treat, cure or prevent any disease.

Do Artificial Sweeteners Help You Lose Weight?

Sucralose and Weight Loss

Author: Dr. Stephen Chaney


Do artificial sweeteners help you lose weight?

It’s a puzzle. We are drinking more artificially sweetened foods and sodas than ever. We’ve been told that those artificially sweeteners will help us cut calories and keep us slender. Yet, surprisingly, we’re fatter than ever.

Let me put some numbers to that statement. The number of people consuming calorie free sodas in the US alone increased from 70 million to 260 million between 1987 and 2000. During that same time period, the percentage of overweight adults in this country increased from 52% to 66%; the percentage of obese adults increased from 20% to 32%; and the percentage of obese children increased from 10% to 17%. Clearly something isn’t working.

And, it may just be the artificial sweeteners that aren’t working. A study published in 2007 (R. Dingra et al, Circulation, 116: 480-484, 2007 ) showed that people consuming regular (sugar containing) sodas were 48% more likely to become obese over a four-year period than people who primarily drank water. That wasn’t surprising. The surprising finding from this study was that people who consumed diet sodas were just as likely to become obese as those drinking regular sodas.

Now you may be saying: “Wait a minute. I thought I read that consuming diet sodas actually helps people lose weight.” The answer is that in those studies dietitians rigorously controlled the caloric intake from other foods so that the only caloric difference was between the diet sodas and the regular sodas. Under those conditions the results are fairly obvious. Fewer calories from sodas = weight loss. But those aren’t the results that you see in free living populations where you don’t have a dietitian peering over your shoulder. In those populations people consuming diet sodas tend to take in the same number of total calories overall and gain just as much weight as people drinking regular sodas.


Do Artificial Sweeteners Prevent Weight Loss?


Obviously, people consuming diet sodas which contain artificial sweeteners must compensate by consuming extra calories from other foods. But, why are they consuming those extra calories? Some experts hypothesize that the answer is physiological. The sweet taste of the diet sodas triggers the release of insulin, which drives down blood sugar levels and makes people hungrier. Other experts hypothesize that the answer is psychological. People simply feel virtuous for consuming the diet sodas and feel they can now splurge somewhere else.

do artificial sweeteners help you lose weightAnimal studies have suggested that the cause may actually be physiological. Those studies have shown that there are “sweetness receptors” in the intestine that respond to the sweetness of sugars and trigger an increase in the level of proteins that transport sugars from the intestine into the bloodstream. That makes great sense from an evolutionary point of view. If we’re eating a low carbohydrate diet we really don’t want to waste a lot of energy producing proteins that transport sugars into our bloodstream. However, whenever we eat foods high in carbohydrates we don’t want to waste that carbohydrate. So, our intestine rapidly breaks the carbohydrates down to simple sugars, and our body responds by increasing our ability to transport those simple sugars into the bloodstream.

This can lead to blood sugar swings and increased food cravings. You’ve heard about the blood sugar swings associated with meals high in simple sugars. When sugars enter the bloodstream very rapidly, blood sugar levels increase, which causes insulin to be secreted. The insulin drives down blood sugar levels, leading to hypoglycemia and increased hunger. That’s a highly simplified scenario, but you get the general idea.

Now the interesting thing is that animal studies have suggested that artificial sweeteners are also recognized by the intestinal “sweetness receptors”. So artificial sweeteners also trigger an increase in the intestinal sugar transporters and prime the body so that blood sugar swings are more likely to occur whenever we eat carbohydrates.

While the results from animal studies have been very consistent with this model, the results from human clinical studies have been mixed. Some studies have suggested that artificial sweeteners do increase the likelihood of blood sugar swings, while other studies have reported that artificial sweeteners have no effect on blood glucose and insulin levels.

With this in mind, do artificial sweeteners help you lose weight?  Let’s continue to investigate.


Do Artificial Sweeteners Help You Lose Weight?


A recent study (M.Y. Pepinoet al, Diabetes Care, 36: 2530-2535, 2013 ) provides a possible explanation for these conflicting results. This study was similar to many of the previous studies in that obese adults were given either sucralose (an artificial sweetener) or water 10 min before being given a fixed amount of glucose, and blood sugar and insulin levels were followed over the next five hours. What made this study unique was that overweight participants were selected who did not normally consume artificially sweetened beverages or foods (Those people are hard to find in the overweight US population).

artificial sweetenersAnd the results were fairly clear-cut. The participants consuming sucralose prior to the glucose load had a 20% greater increase in blood sugar levels, a 20% greater increase in the amount of insulin produced, and significantly lower blood sugar levels three hours after the glucose load than participants consuming water prior to the glucose load. In the words of the authors: “These data suggest that sucralose ingestion is not physiologically inert but affects the glycemic [blood sugar] response to oral glucose load and potentiates glucose stimulated insulin secretion in obese people.” Basically, what they are saying is that sucralose primes their bodies so that they are more likely to experience blood sugar swings when they subsequently consume carbohydrates. [And that can lead to food cravings and weight gain.]

The authors hypothesized that some previous studies had not found an effect of artificial sweeteners on blood sugar and insulin levels because most of the people in those studies were already consuming artificially sweetened beverages on a regular basis and their intestinal sugar transport proteins were already maximally stimulated. Basically, what they are saying is that when someone is regularly consuming artificial sweeteners the damage has already been done (sugar transport is already maximal), and a single dose of an artificial sweetener will not have any significant additional effect.

So, do artificial sweeteners help you lose weight?  I think you know.


The Bottom Line


It has become clear in recent years that artificially-sweetened diet sodas and diet foods are not effective at preventing weight gain, and may, in fact, contribute to weight gain. There is also increasing evidence that artificially-sweetened diet sodas may be harmful to our health. In fact, an international consortium of obesity experts recently concluded: “The absence of evidence to support the role of artificially sweetened beverages in preventing weight gain and the lack of studies on their long-term effects on health strengthen the position that artificially-sweetened beverages should not be promoted as part of a healthy diet.”


However, the reason why diet sodas appear to promote obesity rather than prevent it has remained elusive.

  • A recent study suggests that sucralose (and presumably other artificial sweeteners) triggers a complex serious of metabolic responses that lead to increased appetite and food cravings.
  • However, this is just one small study. Many more studies will be required before we understand why artificial sweeteners promote obesity, rather than prevent it.
  • However, it is clear that artificial sweeteners are not the simple, magical solutions for weight control that food manufacturers and advertisers would have you believe.
    • There are unresolved safety issues with all the artificial sweeteners – but that’s another subject for another day.
    • There is no convincing evidence that artificial sweeteners actually help you lose weight unless you are very carefully controlling the calories from all the other foods you’re eating – and if you’re doing that successfully, you probably don’t need artificial sweeteners in the first place.
    • There is some evidence that artificial sweeteners may actually cause blood sugar swings and make you hungrier, thus making it harder – not easier – to control your weight.
  • The best solution to weight control is always true lifestyle change that includes exercise, healthy foods, and reduced caloric intake and is not based on gimmicks or artificial ingredients.

For more details, read the article above.


These statements have not been evaluated by the Food and Drug Administration. This information is not intended to diagnose, treat, cure or prevent any disease.

Which Foods Lower Blood Sugar?

Can You Believe The “Experts”?

Author: Dr. Stephen Chaney

which foods lower blood sugarYour blood sugar levels have been creeping up. Your doctor has been bugging you to do something about it – even threatening to put you on medications if you don’t get your blood sugar under control. So, which foods lower blood sugar?

Now it’s the first of the year, and you’ve vowed to do something about it. You have vowed to make better food choices. That should be easy. There is lots of great advice about foods that lower blood sugar on the internet. For example, in a recent search, I found articles proclaiming “9 foods that lower blood sugar”, “7 foods that control blood sugar”, and “12 power foods to beat diabetes”.

But, are those foods the right ones for you? What if we are remarkably different in our blood sugar responses to the same food? This is just what a recent study suggests.

How Was The Study Designed?

A group of scientists in Isreal set out to test the hypothesis that people eating identical meals might have a high variability in their post-meal blood glucose response (Zeevi et al, Cell, 163, 1079-1094, 2015).

measure glucoseThe investigators enrolled 800 subjects ages 18-70 into their study. None of the individuals had diabetes. However, 54% of them were overweight (BMI ≥ 25 kg/m2) and 22% of them were obese (BMI ≥ 30 kg/m2). Thus, their subject population was typical of the adult population of almost every Western, industrialized country.

All 800 subjects were followed for one week during which time:

  • They were connected to a continuous glucose monitor, which measured their blood glucose levels every 5 seconds.
  • They were given a Smartphone app and instructed to log their food intake, exercise, and sleep in real time.
  • They were told to follow their normal daily routine and dietary habits except for the first meal of every day, which consisted of five different types of standardized “meals” (glucose, fructose, bread, bread with butter, bread with chocolate), all providing 50 gm of available carbohydrate.

The glucose monitor recorded blood sugar responses for 2 hours following each meal. From that information, the investigators calculated a PPGR (post-prandial glycemic response), which I will mercifully refer to as “blood sugar response”, for every meal eaten by every subject throughout the week.

The standardized “meals” eaten at the beginning of the day were used to validate the study. For example:

  • Two of the standardized meals were given to each subject twice during the study separated by at least one day.
    • There was very little variability in blood sugar response when the same standardized meal was given to the same subject on different days.
    • However, there was a significant amount of variability in blood sugar response when the same standardized meal was given to different subjects.
  • The average blood sugar response to each of the standardized meals was very similar to literature values from previous studies (Most previous studies have reported only average blood sugar responses, not individual variability).

In short, the results from the standardized “meals” validated both the reliability and reproducibility of the data.

Finally, to eliminate as many confounding variables as possible, the investigators compared blood sugar response only for those meals in which a single food was the major component of the meal and that food provided 20-40 gm of carbohydrate.

Here is where things got really interesting!

Which Foods Lower Blood Sugar?

breadThis study showed that there is tremendous individual variability in the blood sugar response to any given food. For example, individual blood sugar responses varied by:

  • 4-fold for sugar-sweetened soft drinks, grapes and apples.
  • 5-fold for rice.
  • 6-fold for bread and potatoes.
  • 7-fold for ice cream and dates.

Put another way:

  • Some people had almost no blood sugar response to cookies, but a very high blood sugar response to a banana.
  • Other people had almost no blood sugar response to bananas, but a very high blood sugar response to cookies.

That is a pretty striking result. Which foods lower blood sugar? This study suggests that some people trying to control their blood sugar can eat bananas, while others should avoid them. It might even mean that some people trying to control blood sugar can eat cookies. I know that is what many people would like to hear, but I’m not ready to make that recommendation.

Why Is There So Much Individuality in Blood Sugar Response?

good food choicesYou are probably wondering why there is such variability in blood sugar response to the same foods. There are several factors that influence individual blood sugar response. For example,

  • Overweight and obesity (Both tend to increase blood sugar response).
  • Dietary habits (Meats, particularly fatty meats, processed grains, and simple sugars tend to increase blood sugar response to a given amount of carbohydrate. Unprocessed grains, fresh fruits & vegetables tend to decrease blood sugar response to a given amount of carbohydrate).
  • What we eat with a given meal (Protein, fiber, and fat in a meal can decrease blood sugar response to the carbohydrate in that meal).
  • Physical activity (Increased muscle mass decreases blood sugar response to a given amount of carbohydrate).
  • The bacteria in our intestine (This may be a chicken-and egg thing. The bacteria in our intestine are influenced by our dietary habits.)
  • Genetics.
  • Things we don’t yet know about.

The good news is that we can actually control some of these variables. The ones over which we have the most control are weight, dietary habits, what we eat along with the carbohydrates in our meals, and physical activity.

What Does This Mean For You?

blood sugarThe authors concluded that “universal dietary recommendations [for lowering blood sugar levels] may have limited utility.”  That is because dietary recommendations are based on average responses and none of us are average. As the saying goes “We are all wonderfully [and differently] made”.

So, when you read about diets and foods that will help you keep your blood sugar levels under control, take those recommendations with a grain of…sugar. They are a good starting place, but you need to listen to your body, and eat the foods that work best for you.  So, which foods lower blood sugar?  It is different for different people, but there are some variables you can control.

Don’t get carried away, however. I’m pretty sure Twinkies washed down with a soft drink are bad for just about everyone.

More importantly, control the variables you can – weight, dietary habits, foods you eat along with carbohydrates, and physical activity. If you control those four variables, you will be well on your way to ideal blood sugar control.


The Bottom Line


  • A recent study has shown that there is tremendous variability in blood sugar response to identical meals from one individual to the next.
  • The authors of the study concluded that “universal dietary recommendations [for lowering blood sugar levels] may have limited utility.” That is because dietary recommendations are based on average responses, and none of us are average.
  • So, when you read about diets and foods that will help you keep your blood sugar levels under control, take those recommendations with a grain of…sugar. They are a good starting place, but you need to listen to your body, and eat the foods that work best for you.
  • There are variables influencing our blood sugar response that we cannot control, such as genetics. However, there are some very important variables that we can control. For example, we can improve our blood sugar response by:
    • Attaining and maintaining ideal weight. Losing as little as 5-10 pounds can result in a significant improvement.


    • Eating a diet that emphasizes fresh fruits & vegetables, nuts, and whole grains and minimizes meats, especially fatty meats, processed grains, and simple sugars. This may act by influencing the bacteria that populate our intestine.


    • Consuming carbohydrates along with protein, fiber-rich foods, and even some fat in the same meal.


    • Increasing physical activity, especially activity that increases lean muscle mass.


These statements have not been evaluated by the Food and Drug Administration. This information is not intended to diagnose, treat, cure or prevent any disease.

Health Tips From The Professor